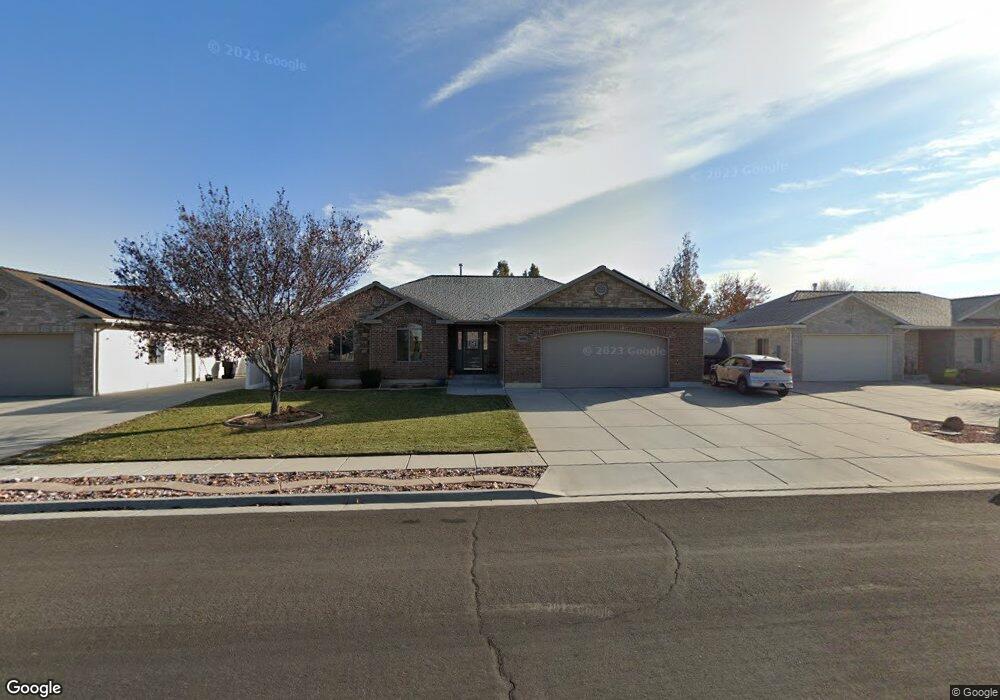
976 N 1445 W Clearfield, UT 84015
Estimated Value: $612,000 - $681,000
4
Beds
4
Baths
1,680
Sq Ft
$379/Sq Ft
Est. Value
About This Home
This home is located at 976 N 1445 W, Clearfield, UT 84015 and is currently estimated at $637,126, approximately $379 per square foot. 976 N 1445 W is a home located in Davis County with nearby schools including Clinton Elementary School, Sunset Junior High School, and Clearfield High School.
Ownership History
Date
Name
Owned For
Owner Type
Purchase Details
Closed on
May 29, 2014
Sold by
Christensen Ronald D and Christensen Shari L
Bought by
The Christensen Family Trust and Christensen Shari L
Current Estimated Value
Purchase Details
Closed on
May 12, 2006
Sold by
Ken Mitchell Development Co Inc
Bought by
Christensen Ronald D and Christensen Shari L
Home Financials for this Owner
Home Financials are based on the most recent Mortgage that was taken out on this home.
Original Mortgage
$50,000
Outstanding Balance
$28,634
Interest Rate
6.3%
Mortgage Type
Fannie Mae Freddie Mac
Estimated Equity
$608,492
Purchase Details
Closed on
May 10, 2006
Sold by
Kecher Development Llc
Bought by
Ken Mitchell Development Co Inc
Home Financials for this Owner
Home Financials are based on the most recent Mortgage that was taken out on this home.
Original Mortgage
$50,000
Outstanding Balance
$28,634
Interest Rate
6.3%
Mortgage Type
Fannie Mae Freddie Mac
Estimated Equity
$608,492
Create a Home Valuation Report for This Property
The Home Valuation Report is an in-depth analysis detailing your home's value as well as a comparison with similar homes in the area
Home Values in the Area
Average Home Value in this Area
Purchase History
| Date | Buyer | Sale Price | Title Company |
|---|---|---|---|
| The Christensen Family Trust | -- | None Available | |
| Christensen Ronald D | -- | Founders Title Co | |
| Ken Mitchell Development Co Inc | -- | Founders Title Co |
Source: Public Records
Mortgage History
| Date | Status | Borrower | Loan Amount |
|---|---|---|---|
| Open | Christensen Ronald D | $50,000 |
Source: Public Records
Tax History
| Year | Tax Paid | Tax Assessment Tax Assessment Total Assessment is a certain percentage of the fair market value that is determined by local assessors to be the total taxable value of land and additions on the property. | Land | Improvement |
|---|---|---|---|---|
| 2025 | $3,449 | $331,650 | $90,501 | $241,149 |
| 2024 | $3,278 | $316,800 | $99,465 | $217,335 |
| 2023 | $3,036 | $543,000 | $113,191 | $429,809 |
| 2022 | $3,169 | $313,500 | $69,209 | $244,291 |
| 2021 | $2,977 | $437,000 | $86,692 | $350,308 |
| 2020 | $2,637 | $383,000 | $73,690 | $309,310 |
| 2019 | $2,544 | $361,000 | $86,064 | $274,936 |
| 2018 | $2,482 | $346,000 | $64,757 | $281,243 |
| 2016 | $2,251 | $162,030 | $30,661 | $131,369 |
| 2015 | $2,326 | $159,225 | $30,661 | $128,564 |
| 2014 | $2,186 | $152,027 | $30,661 | $121,366 |
| 2013 | -- | $135,473 | $31,020 | $104,453 |
Source: Public Records
Map
Nearby Homes
- 1654 W 600 N
- 1411 W 570 N
- 1038 W 800 N
- 563 N 1350 W Unit 139
- 1350 W 300 N Unit 29
- 1125 W 700 N
- 844 N 1000 W
- 1331 N 1850 W
- 575 N 1350 W Unit 137
- 1174 W 1580 N
- 1657 N 1500 W
- 1132 N 780 W
- 417 N 1200 W Unit 84
- 1251 W 400 N Unit 67
- 607 N 2000 W
- 1239 W 400 N Unit 63
- 1681 W 350 N
- 2132 W 800 N
- 690 Barlow St
- 1467 W 1750 N
Your Personal Tour Guide
Ask me questions while you tour the home.