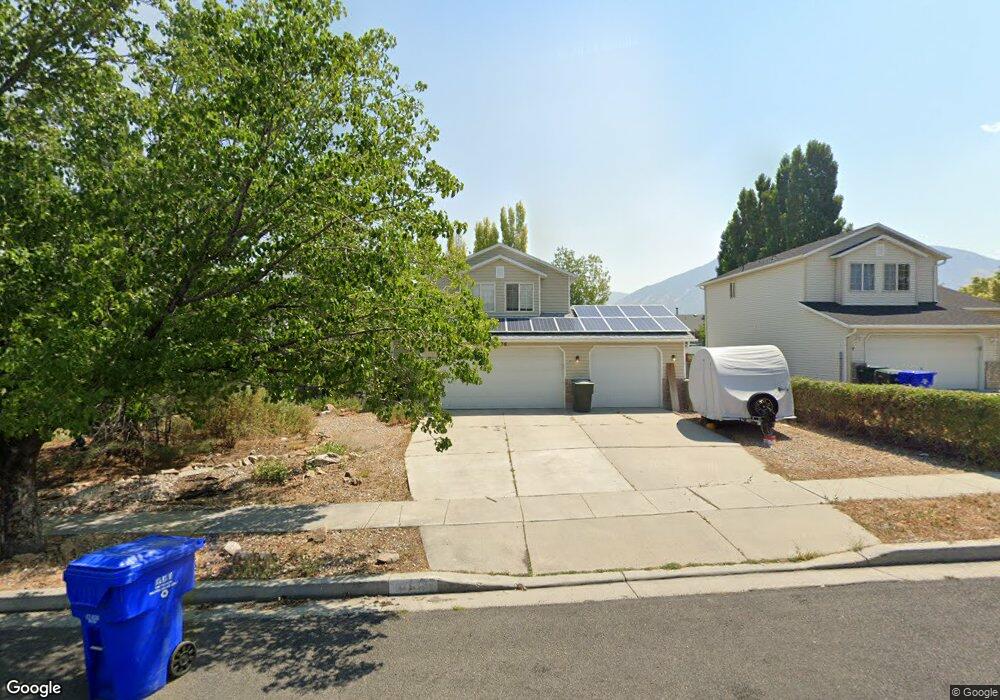
976 N Broadway St Tooele, UT 84074
Estimated Value: $381,000 - $461,000
3
Beds
2
Baths
1,791
Sq Ft
$231/Sq Ft
Est. Value
About This Home
This home is located at 976 N Broadway St, Tooele, UT 84074 and is currently estimated at $413,345, approximately $230 per square foot. 976 N Broadway St is a home located in Tooele County with nearby schools including Copper Canyon Elementary School, Clarke N. Johnsen Junior High School, and Stansbury High School.
Ownership History
Date
Name
Owned For
Owner Type
Purchase Details
Closed on
Nov 23, 2010
Sold by
Stone Larry R and Stone Gloria G
Bought by
Delph Robert and Delph Jessica
Current Estimated Value
Home Financials for this Owner
Home Financials are based on the most recent Mortgage that was taken out on this home.
Original Mortgage
$170,984
Outstanding Balance
$112,179
Interest Rate
4.16%
Mortgage Type
New Conventional
Estimated Equity
$301,166
Purchase Details
Closed on
Apr 21, 2006
Sold by
Millward Debbie K
Bought by
Stone Larry R and Stone Gloria G
Purchase Details
Closed on
Jan 17, 2006
Sold by
Russell Thomas A
Bought by
Millward Debbie K
Purchase Details
Closed on
Jun 25, 2001
Sold by
Russell Colleen
Bought by
Reese Jason and Reese Family Trust
Create a Home Valuation Report for This Property
The Home Valuation Report is an in-depth analysis detailing your home's value as well as a comparison with similar homes in the area
Home Values in the Area
Average Home Value in this Area
Purchase History
| Date | Buyer | Sale Price | Title Company |
|---|---|---|---|
| Delph Robert | -- | Cornerstone Title Insurance | |
| Stone Larry R | -- | First American Title Ins Age | |
| Millward Debbie K | $138,864 | None Available | |
| Reese Jason | -- | None Available |
Source: Public Records
Mortgage History
| Date | Status | Borrower | Loan Amount |
|---|---|---|---|
| Open | Delph Robert | $170,984 |
Source: Public Records
Tax History Compared to Growth
Tax History
| Year | Tax Paid | Tax Assessment Tax Assessment Total Assessment is a certain percentage of the fair market value that is determined by local assessors to be the total taxable value of land and additions on the property. | Land | Improvement |
|---|---|---|---|---|
| 2025 | $2,447 | $204,114 | $46,750 | $157,364 |
| 2024 | $2,592 | $197,871 | $46,750 | $151,121 |
| 2023 | $2,592 | $192,233 | $44,519 | $147,714 |
| 2022 | $2,312 | $198,916 | $44,619 | $154,297 |
| 2021 | $1,897 | $136,538 | $17,848 | $118,690 |
| 2020 | $1,817 | $226,864 | $32,450 | $194,414 |
| 2019 | $1,704 | $209,190 | $32,450 | $176,740 |
| 2018 | $1,673 | $194,780 | $45,000 | $149,780 |
| 2017 | $1,687 | $233,054 | $32,500 | $200,554 |
| 2016 | $1,377 | $113,792 | $17,875 | $95,917 |
| 2015 | $1,377 | $100,152 | $0 | $0 |
| 2014 | -- | $70,373 | $0 | $0 |
Source: Public Records
Map
Nearby Homes
- 180 1000 N
- 455 Lindy Way
- 1151 N 490 E
- 516 N Broadway Ave
- 588 E 1030 N
- 367 E 740 N
- Saddlewood Plan at Bevan Estates - Tooele
- Springhill Plan at Bevan Estates - Tooele
- 779 N 560 E
- 647 E 980 N
- 875 N 650 E
- 475 E 1310 N
- 336 E 700 N
- 876 N Fox Run Dr
- 252 E 715 N Unit 216
- 261 E 670 N Unit 220
- 1451 N 380 E
- 1397 N 550 E
- 535 E 670 N
- 1194 N 690 E
- 956 N Broadway St
- 966 N Broadway St
- 986 N Broadway St
- 975 N 400 E
- 965 N 400 E
- 987 N 400 E
- 355 E 950 N
- 955 N 400 E
- 1837 N 350 E Unit 114
- 1811 N 350 E Unit 110
- 1807 N 350 E Unit 109
- 1887 N 350 E Unit 121
- 1865 N 350 E Unit 118
- 1887 N 350 E
- 1833 N 350 E Unit 113
- 1865 N 350 E
- 358 E 950 N
- 368 E 950 N
- 378 E 950 N
- 388 E 950 N