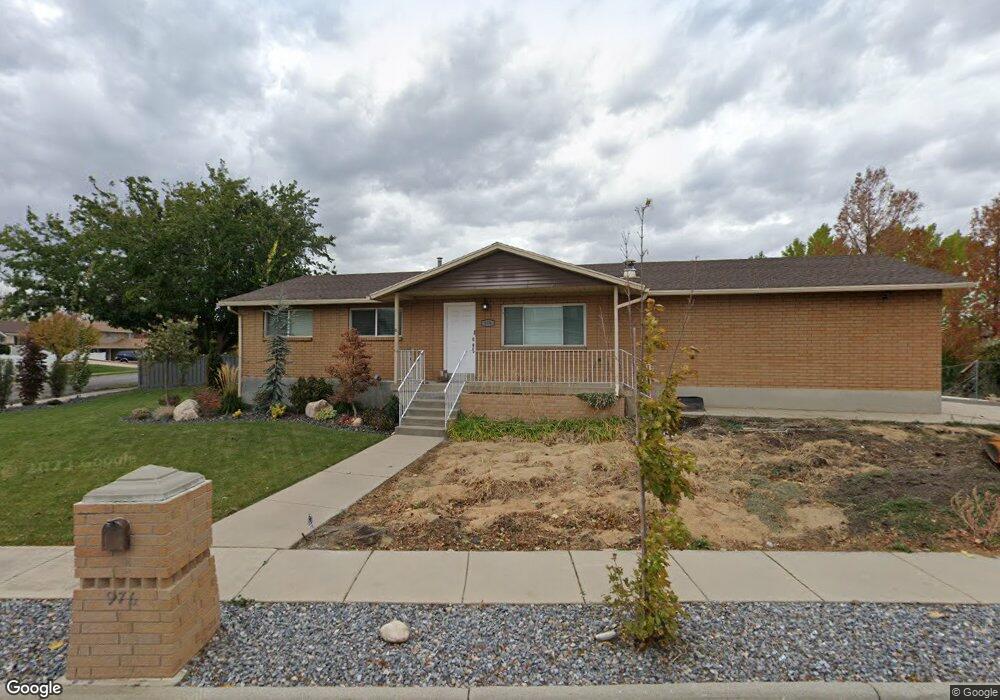
976 W 700 N West Bountiful, UT 84087
Estimated Value: $522,000 - $620,000
5
Beds
2
Baths
2,111
Sq Ft
$267/Sq Ft
Est. Value
About This Home
This home is located at 976 W 700 N, West Bountiful, UT 84087 and is currently estimated at $563,338, approximately $266 per square foot. 976 W 700 N is a home located in Davis County with nearby schools including West Bountiful Elementary School, Bountiful Junior High School, and Viewmont High School.
Ownership History
Date
Name
Owned For
Owner Type
Purchase Details
Closed on
Jan 8, 2019
Sold by
Craig Kari L and Strong Kari L
Bought by
Elliott Rigby W
Current Estimated Value
Home Financials for this Owner
Home Financials are based on the most recent Mortgage that was taken out on this home.
Original Mortgage
$305,550
Outstanding Balance
$269,196
Interest Rate
4.8%
Mortgage Type
New Conventional
Estimated Equity
$294,142
Purchase Details
Closed on
Mar 16, 2006
Sold by
Strong Gregory K
Bought by
Craig Kari L and Strong Kari L
Purchase Details
Closed on
Oct 28, 2004
Sold by
Strong Gregory K
Bought by
Strong Kari L
Purchase Details
Closed on
Nov 19, 2001
Sold by
Hagloch Brent E and Hagloch Michelle G
Bought by
Strong Gregory K and Strong Kari L
Home Financials for this Owner
Home Financials are based on the most recent Mortgage that was taken out on this home.
Original Mortgage
$112,000
Interest Rate
6.57%
Create a Home Valuation Report for This Property
The Home Valuation Report is an in-depth analysis detailing your home's value as well as a comparison with similar homes in the area
Home Values in the Area
Average Home Value in this Area
Purchase History
| Date | Buyer | Sale Price | Title Company |
|---|---|---|---|
| Elliott Rigby W | -- | Meridian Title Company | |
| Craig Kari L | -- | None Available | |
| Strong Kari L | -- | -- | |
| Strong Gregory K | -- | Equity Title Agency |
Source: Public Records
Mortgage History
| Date | Status | Borrower | Loan Amount |
|---|---|---|---|
| Open | Elliott Rigby W | $305,550 | |
| Previous Owner | Strong Gregory K | $112,000 |
Source: Public Records
Tax History Compared to Growth
Tax History
| Year | Tax Paid | Tax Assessment Tax Assessment Total Assessment is a certain percentage of the fair market value that is determined by local assessors to be the total taxable value of land and additions on the property. | Land | Improvement |
|---|---|---|---|---|
| 2025 | $3,551 | $273,900 | $138,320 | $135,580 |
| 2024 | $3,390 | $276,100 | $113,897 | $162,203 |
| 2023 | $3,249 | $484,000 | $214,376 | $269,624 |
| 2022 | $3,066 | $257,400 | $103,691 | $153,709 |
| 2021 | $2,706 | $344,000 | $141,496 | $202,504 |
| 2020 | $2,466 | $303,000 | $130,017 | $172,983 |
| 2019 | $2,173 | $295,000 | $130,184 | $164,816 |
| 2018 | $2,130 | $270,000 | $128,840 | $141,160 |
| 2016 | $1,705 | $123,970 | $35,233 | $88,737 |
| 2015 | $1,643 | $113,740 | $35,233 | $78,507 |
| 2014 | $1,609 | $110,840 | $35,233 | $75,607 |
| 2013 | -- | $103,540 | $33,538 | $70,002 |
Source: Public Records
Map
Nearby Homes
- 280 N 1100 W
- 767 W 220 N
- 825 W 1320 N
- 1084 W Audrey Ln Unit 20
- 1084 W Audrey Ln
- 680 W 500 S Unit 22
- 680 W 500 S Unit 17
- 790 N 500 W
- Carson Plan at Amberly Place
- 2050 Farmhouse Plan at Amberly Place
- Pasadena (Inactive) Plan at Amberly Place
- Portland Plan at Amberly Place
- 340 N 500 W Unit 204
- 637 W 1600 N
- 399 W 400 N Unit 47
- 366 W 1000 N
- 988 W 1950 N Unit 134
- 789 W 1950 N
- Lincoln Farmhouse Plan at Belmont Farms
- Belmont Traditional Plan at Belmont Farms