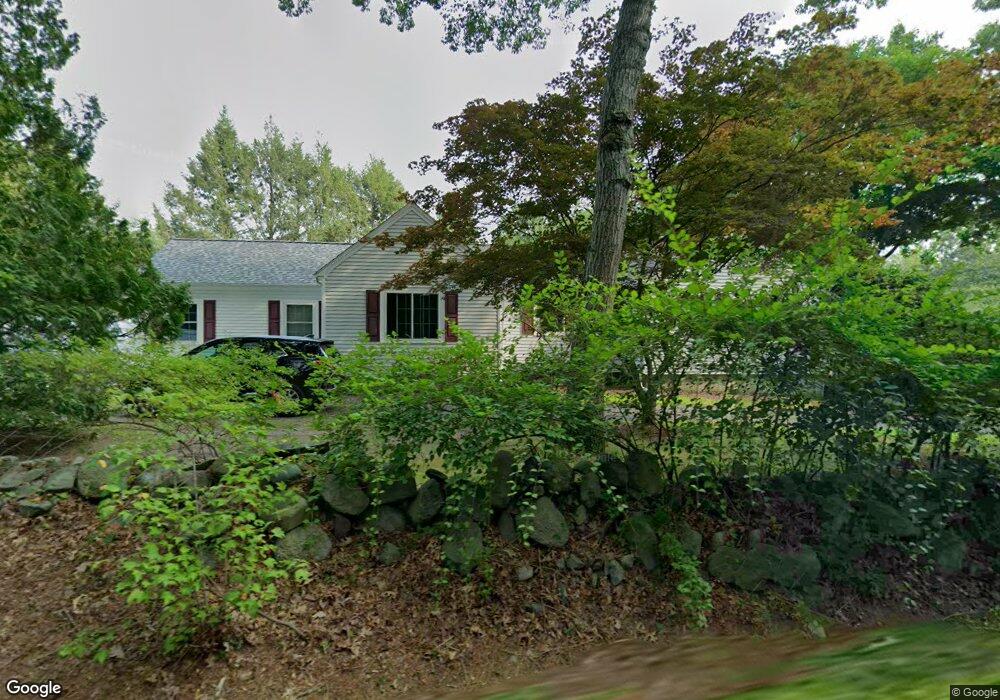
976 West St Mansfield, MA 02048
Estimated Value: $629,480 - $693,000
4
Beds
3
Baths
1,878
Sq Ft
$355/Sq Ft
Est. Value
About This Home
This home is located at 976 West St, Mansfield, MA 02048 and is currently estimated at $666,620, approximately $354 per square foot. 976 West St is a home located in Bristol County with nearby schools including Everett W. Robinson Elementary School, Jordan/Jackson Elementary School, and Harold L. Qualters Middle School.
Ownership History
Date
Name
Owned For
Owner Type
Purchase Details
Closed on
Nov 25, 1992
Sold by
Holm Nicola A
Bought by
Bowler Thomas M and Bowler Donna M
Current Estimated Value
Home Financials for this Owner
Home Financials are based on the most recent Mortgage that was taken out on this home.
Original Mortgage
$124,850
Interest Rate
8.06%
Mortgage Type
Purchase Money Mortgage
Create a Home Valuation Report for This Property
The Home Valuation Report is an in-depth analysis detailing your home's value as well as a comparison with similar homes in the area
Home Values in the Area
Average Home Value in this Area
Purchase History
| Date | Buyer | Sale Price | Title Company |
|---|---|---|---|
| Bowler Thomas M | $124,850 | -- |
Source: Public Records
Mortgage History
| Date | Status | Borrower | Loan Amount |
|---|---|---|---|
| Open | Bowler Thomas M | $53,907 | |
| Closed | Bowler Thomas M | $48,516 | |
| Closed | Bowler Thomas M | $124,850 |
Source: Public Records
Tax History Compared to Growth
Tax History
| Year | Tax Paid | Tax Assessment Tax Assessment Total Assessment is a certain percentage of the fair market value that is determined by local assessors to be the total taxable value of land and additions on the property. | Land | Improvement |
|---|---|---|---|---|
| 2025 | $6,748 | $512,400 | $243,400 | $269,000 |
| 2024 | $6,120 | $453,300 | $243,400 | $209,900 |
| 2023 | $6,009 | $426,500 | $243,400 | $183,100 |
| 2022 | $5,478 | $361,100 | $225,300 | $135,800 |
| 2021 | $4,589 | $343,600 | $197,200 | $146,400 |
| 2020 | $3,170 | $329,800 | $187,800 | $142,000 |
| 2019 | $4,654 | $305,800 | $156,400 | $149,400 |
| 2018 | $4,273 | $280,900 | $149,200 | $131,700 |
| 2017 | $4,267 | $284,100 | $145,000 | $139,100 |
| 2016 | $4,256 | $276,200 | $138,000 | $138,200 |
| 2015 | $3,929 | $253,500 | $138,000 | $115,500 |
Source: Public Records
Map
Nearby Homes