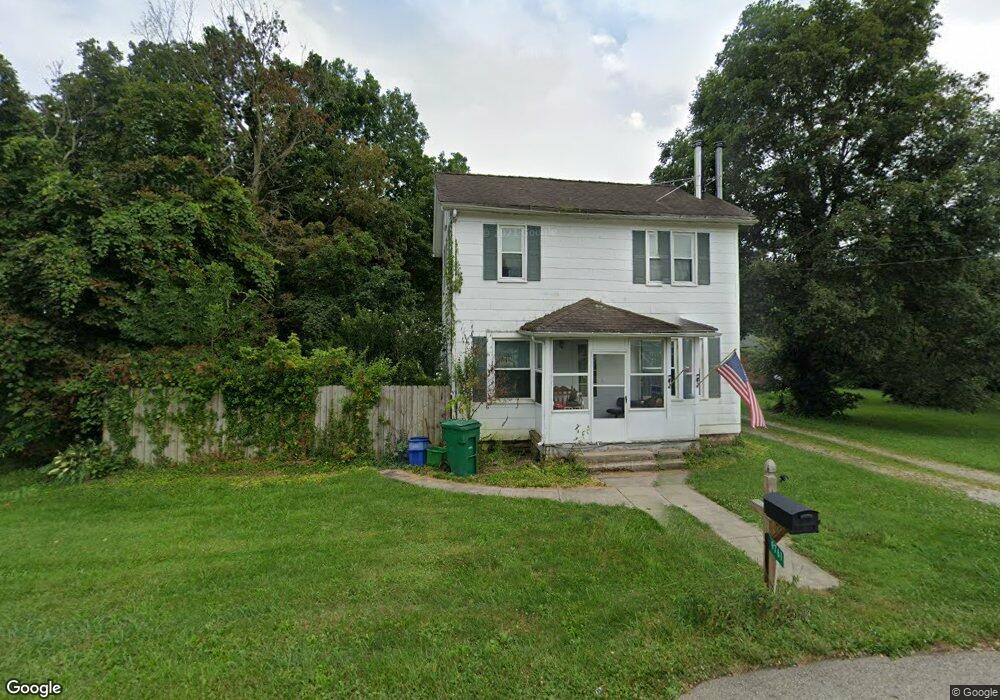
9761 Lower Valley Pike Medway, OH 45341
Estimated Value: $254,000 - $368,000
3
Beds
2
Baths
1,783
Sq Ft
$175/Sq Ft
Est. Value
About This Home
This home is located at 9761 Lower Valley Pike, Medway, OH 45341 and is currently estimated at $312,460, approximately $175 per square foot. 9761 Lower Valley Pike is a home located in Clark County with nearby schools including Donnelsville Elementary School, Park Layne Elementary School, and New Carlisle Elementary School.
Ownership History
Date
Name
Owned For
Owner Type
Purchase Details
Closed on
Nov 5, 2014
Sold by
Furnas Terrie J and Furnas Kevin J
Bought by
Board Of Clark County Commissioners
Current Estimated Value
Purchase Details
Closed on
May 31, 2001
Sold by
Gros Keith V and Gros Dana M
Bought by
Furnas Kevin J and Furnas Terrie J
Home Financials for this Owner
Home Financials are based on the most recent Mortgage that was taken out on this home.
Original Mortgage
$135,200
Interest Rate
7.18%
Purchase Details
Closed on
Dec 19, 1997
Sold by
Hogue Francis R
Bought by
Gros Keith V and Gros Dana M
Home Financials for this Owner
Home Financials are based on the most recent Mortgage that was taken out on this home.
Original Mortgage
$135,850
Interest Rate
7.35%
Purchase Details
Closed on
Jan 7, 1997
Sold by
Towner H Stevens Est
Bought by
Francis R Hogue
Create a Home Valuation Report for This Property
The Home Valuation Report is an in-depth analysis detailing your home's value as well as a comparison with similar homes in the area
Home Values in the Area
Average Home Value in this Area
Purchase History
| Date | Buyer | Sale Price | Title Company |
|---|---|---|---|
| Board Of Clark County Commissioners | $565 | Attorney | |
| Furnas Kevin J | $169,000 | -- | |
| Gros Keith V | $143,000 | -- | |
| Francis R Hogue | $77,000 | -- |
Source: Public Records
Mortgage History
| Date | Status | Borrower | Loan Amount |
|---|---|---|---|
| Previous Owner | Furnas Kevin J | $135,200 | |
| Previous Owner | Gros Keith V | $135,850 | |
| Closed | Furnas Kevin J | $25,350 |
Source: Public Records
Tax History Compared to Growth
Tax History
| Year | Tax Paid | Tax Assessment Tax Assessment Total Assessment is a certain percentage of the fair market value that is determined by local assessors to be the total taxable value of land and additions on the property. | Land | Improvement |
|---|---|---|---|---|
| 2024 | $3,705 | $78,500 | $31,520 | $46,980 |
| 2023 | $3,705 | $78,500 | $31,520 | $46,980 |
| 2022 | $3,712 | $78,500 | $31,520 | $46,980 |
| 2021 | $3,150 | $60,960 | $24,060 | $36,900 |
| 2020 | $3,158 | $60,960 | $24,060 | $36,900 |
| 2019 | $3,246 | $60,960 | $24,060 | $36,900 |
| 2018 | $2,936 | $52,070 | $24,060 | $28,010 |
| 2017 | $2,917 | $52,074 | $24,063 | $28,011 |
| 2016 | $2,796 | $52,074 | $24,063 | $28,011 |
| 2015 | $2,747 | $49,340 | $24,063 | $25,277 |
| 2014 | $2,722 | $49,186 | $23,909 | $25,277 |
| 2013 | $2,728 | $49,186 | $23,909 | $25,277 |
Source: Public Records
Map
Nearby Homes
- 18 Sunset Dr
- 204 E Main St
- 113 W Main St
- 10265 W Union Rd
- 1292 Medway New Carlisle Rd
- 738 S Medway Carlisle Rd
- 15 Tulip Rd
- 108 N Park Dr
- 122 Lake Shore Dr
- 16 Laurel Rd
- 0 Kennedy Rd
- 326 Kennedy Dr
- 423 Sycamore Rd
- 429 Tulip Rd
- 851 Corvette Ave
- 321 Stratmore St
- 1124 Burket Dr
- 216 Braun St
- 1115 Frayne Dr
- 1143 Bookwalter Ave
- 9777 Lower Valley Pike
- 9789 Lower Valley Pike
- 9780 Lower Valley Pike
- 2281 Katherine Blvd
- 9717 Lower Valley Pike
- 9807 Lower Valley Pike
- 9703 Lower Valley Pike
- 2245 Katherine Blvd
- 2284 Katherine Blvd
- 9829 Lower Valley Pike
- 2275 S Union Rd
- 2211 Katherine Blvd
- 2238 Katherine Blvd
- 9845 Lower Valley Pike
- 9673 Lower Valley Pike
- 2177 Katherine Blvd
- 9668 Lower Valley Pike
- 9859 Lower Valley Pike
- 9701 Willis Way
- 9689 Willis Way