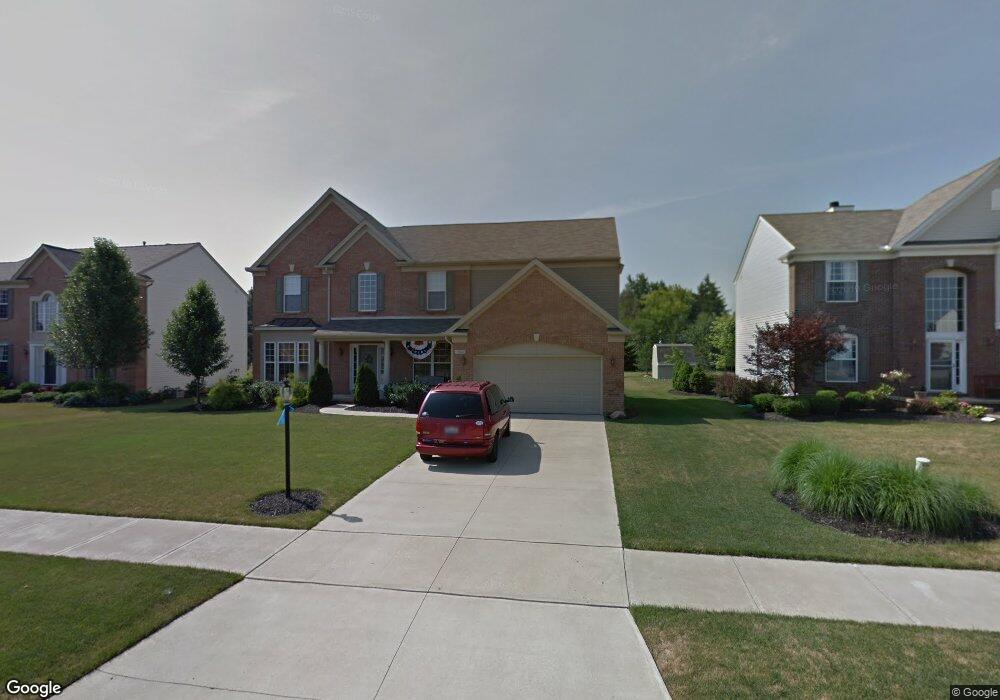
9763 Tuttle Rd Olmsted Falls, OH 44138
Estimated Value: $487,523 - $580,000
4
Beds
3
Baths
3,641
Sq Ft
$142/Sq Ft
Est. Value
About This Home
This home is located at 9763 Tuttle Rd, Olmsted Falls, OH 44138 and is currently estimated at $518,381, approximately $142 per square foot. 9763 Tuttle Rd is a home located in Cuyahoga County with nearby schools including Olmsted Falls Intermediate Building, Falls-Lenox Primary Elementary School, and Olmsted Falls Middle School.
Ownership History
Date
Name
Owned For
Owner Type
Purchase Details
Closed on
Jul 21, 2008
Sold by
Aldi Inc
Bought by
Baracskai Thomas S and Baracskai Bryn E
Current Estimated Value
Home Financials for this Owner
Home Financials are based on the most recent Mortgage that was taken out on this home.
Original Mortgage
$224,000
Outstanding Balance
$145,094
Interest Rate
6.15%
Mortgage Type
Purchase Money Mortgage
Estimated Equity
$373,287
Purchase Details
Closed on
May 7, 2007
Sold by
Colston Lori A and Colston Dwayne N
Bought by
Aldi Inc
Purchase Details
Closed on
Apr 27, 2005
Sold by
Pulte Homes Of Ohio Llc
Bought by
Colston Dwayne N and Colston Lori A
Home Financials for this Owner
Home Financials are based on the most recent Mortgage that was taken out on this home.
Original Mortgage
$248,388
Interest Rate
5.5%
Mortgage Type
Fannie Mae Freddie Mac
Create a Home Valuation Report for This Property
The Home Valuation Report is an in-depth analysis detailing your home's value as well as a comparison with similar homes in the area
Home Values in the Area
Average Home Value in this Area
Purchase History
| Date | Buyer | Sale Price | Title Company |
|---|---|---|---|
| Baracskai Thomas S | $280,000 | Real Living Title Agency Ltd | |
| Aldi Inc | $317,524 | Continental Title Agency | |
| Colston Dwayne N | $310,485 | Pulte Title Agency |
Source: Public Records
Mortgage History
| Date | Status | Borrower | Loan Amount |
|---|---|---|---|
| Open | Baracskai Thomas S | $224,000 | |
| Previous Owner | Colston Dwayne N | $248,388 |
Source: Public Records
Tax History Compared to Growth
Tax History
| Year | Tax Paid | Tax Assessment Tax Assessment Total Assessment is a certain percentage of the fair market value that is determined by local assessors to be the total taxable value of land and additions on the property. | Land | Improvement |
|---|---|---|---|---|
| 2024 | $11,672 | $155,575 | $31,010 | $124,565 |
| 2023 | $11,383 | $123,660 | $25,690 | $97,970 |
| 2022 | $11,311 | $123,660 | $25,690 | $97,970 |
| 2021 | $11,212 | $123,660 | $25,690 | $97,970 |
| 2020 | $11,551 | $113,440 | $23,560 | $89,880 |
| 2019 | $10,473 | $324,100 | $67,300 | $256,800 |
| 2018 | $10,014 | $113,440 | $23,560 | $89,880 |
| 2017 | $9,702 | $101,220 | $21,490 | $79,730 |
| 2016 | $9,660 | $101,220 | $21,490 | $79,730 |
| 2015 | $9,536 | $101,220 | $21,490 | $79,730 |
| 2014 | $9,536 | $95,490 | $20,270 | $75,220 |
Source: Public Records
Map
Nearby Homes
- 26571 Sprague Rd
- 9628 Kingston Trail
- 9954 Ethan Dr
- 27167 Watkin Rd
- 27056 Sprague Rd
- 8706 Stearns Rd
- 8860 Sharp Rd
- 9112 Devonshire Dr
- 9159 E Windsor Dr
- 26645 Lake of the Falls Blvd
- 8481 Jennings Rd
- 26700 Redwood Dr
- 26609 N Park Blvd Unit 26609
- V/L Usher Rd
- 0 V L Schady Rd Unit 5163658
- 26523 Sussex Dr
- 31100 Blooming Ln
- 26511 Locust Dr
- 23663 Victory Ln
- 26788 Skyline Dr
- 9759 Tuttle Rd
- 9755 Tuttle Rd
- 9771 Tuttle Rd
- 9760 Tuttle Rd
- 9751 Tuttle Rd
- 9775 Tuttle Rd
- 9754 Tuttle Rd
- 9764 Tuttle Rd
- 26553 Sprague Rd
- 9768 Tuttle Rd
- 26533 Sprague Rd
- 9743 Tuttle Rd
- 9777 Burts Way
- 9746 Tuttle Rd
- 9744 Kingston Trail
- 9774 Tuttle Rd
- 9739 Kingston Trail
- 9779 Burts Way
- 27167 Phoenix Way
- 29 Station Rd