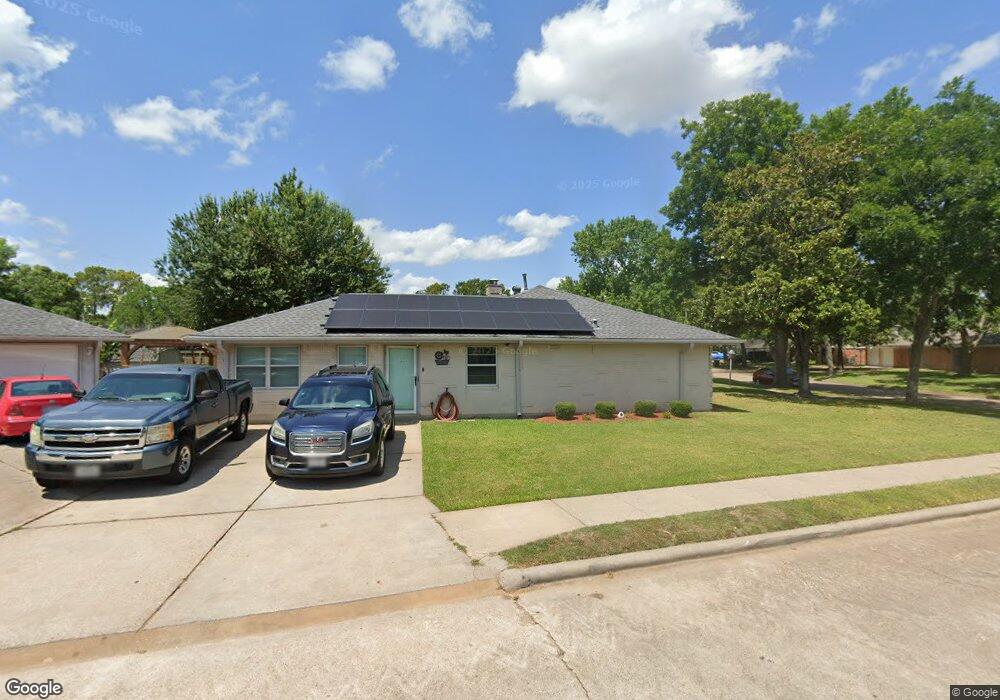
9766 Ebb St Houston, TX 77089
Southbelt-Ellington NeighborhoodEstimated Value: $252,000 - $292,000
3
Beds
2
Baths
2,046
Sq Ft
$133/Sq Ft
Est. Value
About This Home
This home is located at 9766 Ebb St, Houston, TX 77089 and is currently estimated at $272,782, approximately $133 per square foot. 9766 Ebb St is a home located in Harris County with nearby schools including Atkinson Elementary School, Beverly Hill Intermediate School, and Morris Middle School.
Ownership History
Date
Name
Owned For
Owner Type
Purchase Details
Closed on
Nov 17, 2021
Sold by
Fernandez Dennis D
Bought by
Fernandez Dennis D and Fernandez Deyci F
Current Estimated Value
Home Financials for this Owner
Home Financials are based on the most recent Mortgage that was taken out on this home.
Original Mortgage
$146,500
Outstanding Balance
$113,858
Interest Rate
2.37%
Mortgage Type
New Conventional
Estimated Equity
$158,924
Purchase Details
Closed on
Mar 30, 2020
Sold by
Joseph Antonio
Bought by
Escobar Erwin and Fernandez Dennis
Purchase Details
Closed on
May 10, 2005
Sold by
Beard Bettye Jane
Bought by
Fernandez Dennis D
Home Financials for this Owner
Home Financials are based on the most recent Mortgage that was taken out on this home.
Original Mortgage
$99,200
Interest Rate
7%
Mortgage Type
Fannie Mae Freddie Mac
Purchase Details
Closed on
May 12, 1997
Sold by
Bear Bettye Jane and Beard Charlton Russell
Bought by
Beard Bettye Jane
Create a Home Valuation Report for This Property
The Home Valuation Report is an in-depth analysis detailing your home's value as well as a comparison with similar homes in the area
Home Values in the Area
Average Home Value in this Area
Purchase History
| Date | Buyer | Sale Price | Title Company |
|---|---|---|---|
| Fernandez Dennis D | -- | Avenue 365 Lender Svcs Llc | |
| Escobar Erwin | -- | Fidelity National Title | |
| Fernandez Dennis D | -- | Texas American Title Company | |
| Beard Bettye Jane | -- | -- |
Source: Public Records
Mortgage History
| Date | Status | Borrower | Loan Amount |
|---|---|---|---|
| Open | Fernandez Dennis D | $146,500 | |
| Previous Owner | Fernandez Dennis D | $99,200 | |
| Closed | Fernandez Dennis D | $24,800 |
Source: Public Records
Tax History Compared to Growth
Tax History
| Year | Tax Paid | Tax Assessment Tax Assessment Total Assessment is a certain percentage of the fair market value that is determined by local assessors to be the total taxable value of land and additions on the property. | Land | Improvement |
|---|---|---|---|---|
| 2025 | $3,871 | $247,341 | $58,028 | $189,313 |
| 2024 | $3,871 | $264,260 | $58,028 | $206,232 |
| 2023 | $3,871 | $267,994 | $58,028 | $209,966 |
| 2022 | $5,645 | $220,497 | $58,028 | $162,469 |
| 2021 | $5,744 | $224,537 | $42,554 | $181,983 |
| 2020 | $5,328 | $195,428 | $42,554 | $152,874 |
| 2019 | $4,440 | $196,566 | $32,882 | $163,684 |
| 2018 | $1,612 | $140,000 | $29,787 | $110,213 |
| 2017 | $3,666 | $153,576 | $29,787 | $123,789 |
| 2016 | $3,332 | $128,469 | $29,787 | $98,682 |
| 2015 | $1,061 | $115,384 | $21,277 | $94,107 |
| 2014 | $1,061 | $108,843 | $21,277 | $87,566 |
Source: Public Records
Map
Nearby Homes
- 11311 Caribbean Ln
- 11303 Caribbean Ln
- 9743 Santa Monica Blvd
- 10906 Keese Dr
- 9711 Ebb St
- 10815 Ritow St
- 11414 Kirkwyn Dr
- 10207 Rambling Trail
- 10214 Buena Park Dr
- 10406 Sagestar Ln
- 10410 Sagestar Ln
- 10411 Sagewillow Ln
- 10018 Ramey St
- 10415 Sagewillow Ln
- 10519 Sagepark Ln
- 10619 Wheaton Dr
- 9914 Sumerlin St
- 9407 Kingspass St
- 10810 Kirkbend Dr
- 10442 Southport Dr
- 9762 Ebb St
- 9751 Santa Monica Blvd
- 9754 Ebb St
- 9759 Santa Monica Blvd
- 11307 Caribbean Ln
- 9747 Santa Monica Blvd
- 11315 Caribbean Ln
- 9759 Ebb St
- 11231 Caribbean Ln
- 11319 Caribbean Ln
- 9739 Santa Monica Blvd
- 9755 Ebb St
- 11227 Caribbean Ln
- 9746 Ebb St
- 10906 Twig Dr
- 10910 Twig Dr
- 9735 Santa Monica Blvd
- 10902 Twig Dr
- 11218 Caribbean Ln
- 11323 Caribbean Ln