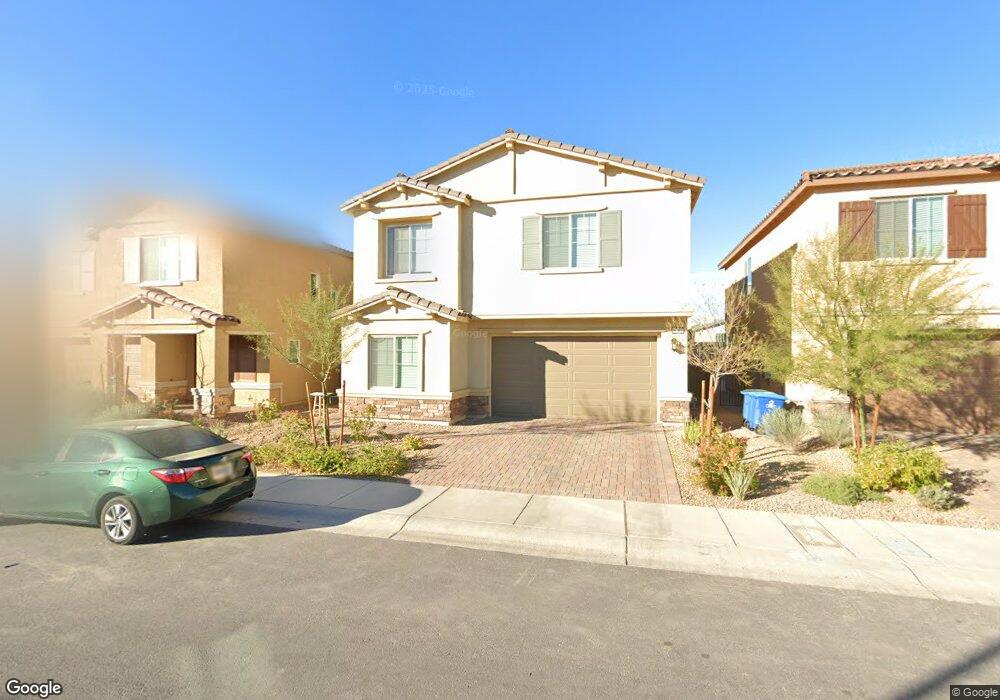
9767 Millington St Las Vegas, NV 89141
Highlands Ranch NeighborhoodEstimated Value: $582,000 - $647,000
4
Beds
3
Baths
2,704
Sq Ft
$225/Sq Ft
Est. Value
About This Home
This home is located at 9767 Millington St, Las Vegas, NV 89141 and is currently estimated at $609,317, approximately $225 per square foot. 9767 Millington St is a home with nearby schools including Dennis Ortwein Elementary, Lois & Jerry Tarkanian Middle School, and Desert Oasis High School.
Ownership History
Date
Name
Owned For
Owner Type
Purchase Details
Closed on
Jul 14, 2021
Sold by
Greystone Nevada Llc
Bought by
Yan Son Ha and Sun Neth
Current Estimated Value
Home Financials for this Owner
Home Financials are based on the most recent Mortgage that was taken out on this home.
Original Mortgage
$200,000
Outstanding Balance
$181,469
Interest Rate
2.9%
Mortgage Type
New Conventional
Estimated Equity
$427,848
Purchase Details
Closed on
Jul 13, 2021
Sold by
Hak Sotheara
Bought by
Sun Neth
Home Financials for this Owner
Home Financials are based on the most recent Mortgage that was taken out on this home.
Original Mortgage
$200,000
Outstanding Balance
$181,469
Interest Rate
2.9%
Mortgage Type
New Conventional
Estimated Equity
$427,848
Create a Home Valuation Report for This Property
The Home Valuation Report is an in-depth analysis detailing your home's value as well as a comparison with similar homes in the area
Home Values in the Area
Average Home Value in this Area
Purchase History
| Date | Buyer | Sale Price | Title Company |
|---|---|---|---|
| Yan Son Ha | $447,441 | Lennar Title | |
| Sun Neth | -- | Lennar Title |
Source: Public Records
Mortgage History
| Date | Status | Borrower | Loan Amount |
|---|---|---|---|
| Open | Sun Neth | $200,000 |
Source: Public Records
Tax History Compared to Growth
Tax History
| Year | Tax Paid | Tax Assessment Tax Assessment Total Assessment is a certain percentage of the fair market value that is determined by local assessors to be the total taxable value of land and additions on the property. | Land | Improvement |
|---|---|---|---|---|
| 2025 | $5,439 | $187,692 | $39,375 | $148,317 |
| 2024 | $5,037 | $187,692 | $39,375 | $148,317 |
| 2023 | $4,357 | $182,200 | $43,750 | $138,450 |
| 2022 | $4,664 | $158,930 | $33,250 | $125,680 |
| 2021 | $4,357 | $29,925 | $29,925 | $0 |
| 2020 | $834 | $28,350 | $28,350 | $0 |
Source: Public Records
Map
Nearby Homes
- 4176 Blue Quail Ct
- 4246 W Landberg Ave
- Plan 1 at Southridge Pointe
- Plan 2X at Southridge Pointe
- Plan 3 at Southridge Pointe
- Plan 2 at Southridge Pointe
- 4185 Texas Lilac Ave
- 4193 Texas Lilac Ave
- 9844 Kings Glen St
- 9829 Kings Glen St
- 4172 Texas Lilac Ave
- 9661 Hinson St
- 9864 Kings Glen St
- 4204 Texas Lilac Ave
- 4333 Tabor Peak Ave
- 4344 Tallow Falls Ave
- 9213 Broome Ct
- 9225 Broome Ct
- 9735 Terra Canyon St
- 4395 Sunburst Spring Ave
- 9775 Millington St
- 9759 Millington St
- 9783 Millington St
- 9751 Millington St
- 9766 Homestead Mesa St
- 9776 Homestead Mesa St
- 9756 Homestead Mesa St
- 9791 Millington St
- 9766 Millington St
- 9774 Millington St
- 9758 Millington St
- 9786 Homestead Mesa St
- 9782 Millington St
- 9799 Millington St
- 9790 Millington St
- 9796 Homestead Mesa St
- 9738 Hinson St
- 4109 Orchard Run Ave
- 9798 Millington St
- 9807 Millington St