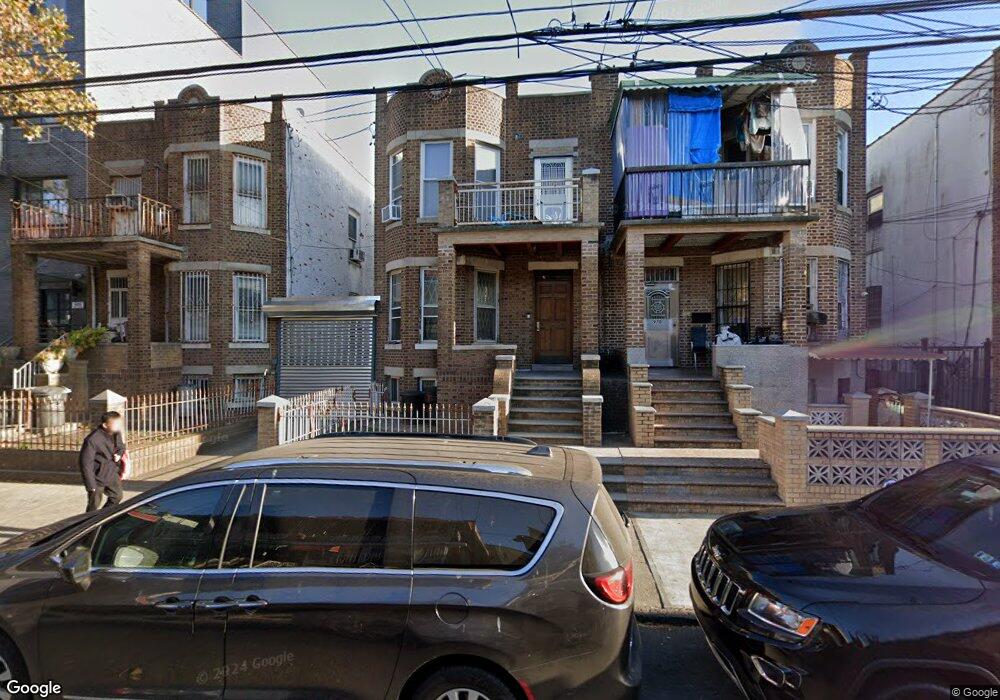
977 57th St Brooklyn, NY 11219
Borough Park NeighborhoodEstimated Value: $1,887,000 - $2,396,000
Studio
--
Bath
3,540
Sq Ft
$600/Sq Ft
Est. Value
About This Home
This home is located at 977 57th St, Brooklyn, NY 11219 and is currently estimated at $2,123,346, approximately $599 per square foot. 977 57th St is a home located in Kings County with nearby schools including P.S. 105 The Blythebourne, I.S. 223 The Montauk, and Franklin Delano Roosevelt High School.
Ownership History
Date
Name
Owned For
Owner Type
Purchase Details
Closed on
May 13, 2020
Sold by
Li Yan Yun and Zheng Xi
Bought by
Zheng Xi
Current Estimated Value
Home Financials for this Owner
Home Financials are based on the most recent Mortgage that was taken out on this home.
Original Mortgage
$68,998
Outstanding Balance
$60,873
Interest Rate
3.3%
Mortgage Type
New Conventional
Estimated Equity
$2,062,473
Purchase Details
Closed on
Jun 24, 2019
Sold by
Li Yan Yun
Bought by
Li Yanyun and Zheng Xi
Purchase Details
Closed on
Aug 15, 2001
Sold by
Chin Juk Nin and Chen Xiu Fang
Bought by
Li Yan Yun
Home Financials for this Owner
Home Financials are based on the most recent Mortgage that was taken out on this home.
Original Mortgage
$351,900
Interest Rate
6.89%
Mortgage Type
Purchase Money Mortgage
Purchase Details
Closed on
Jun 16, 1995
Sold by
Chin Siu Ngee and Chin Juk Nin
Bought by
Chin Juk Nin and Chen Xiu Fang
Create a Home Valuation Report for This Property
The Home Valuation Report is an in-depth analysis detailing your home's value as well as a comparison with similar homes in the area
Home Values in the Area
Average Home Value in this Area
Purchase History
| Date | Buyer | Sale Price | Title Company |
|---|---|---|---|
| Zheng Xi | -- | -- | |
| Zheng Xi | -- | -- | |
| Zheng Xi | -- | -- | |
| Li Yanyun | -- | -- | |
| Li Yanyun | -- | -- | |
| Li Yanyun | -- | -- | |
| Li Yan Yun | -- | -- | |
| Li Yan Yun | -- | -- | |
| Chin Juk Nin | -- | -- | |
| Chin Juk Nin | -- | -- |
Source: Public Records
Mortgage History
| Date | Status | Borrower | Loan Amount |
|---|---|---|---|
| Open | Zheng Xi | $68,998 | |
| Closed | Zheng Xi | $68,998 | |
| Previous Owner | Li Yan Yun | $351,900 |
Source: Public Records
Tax History
| Year | Tax Paid | Tax Assessment Tax Assessment Total Assessment is a certain percentage of the fair market value that is determined by local assessors to be the total taxable value of land and additions on the property. | Land | Improvement |
|---|---|---|---|---|
| 2025 | $10,708 | $123,180 | $28,140 | $95,040 |
| 2024 | $10,708 | $97,320 | $28,140 | $69,180 |
| 2023 | $10,216 | $118,800 | $28,140 | $90,660 |
| 2022 | $9,527 | $130,140 | $28,140 | $102,000 |
| 2021 | $9,501 | $117,300 | $28,140 | $89,160 |
| 2019 | $9,294 | $90,960 | $28,140 | $62,820 |
| 2018 | $8,545 | $41,920 | $16,847 | $25,073 |
| 2017 | $8,107 | $39,770 | $12,899 | $26,871 |
| 2016 | $7,521 | $37,621 | $13,882 | $23,739 |
| 2015 | $4,305 | $37,621 | $14,649 | $22,972 |
| 2014 | $4,305 | $37,024 | $15,082 | $21,942 |
Source: Public Records
Map
Nearby Homes
- 1012 57th St
- 944 56th St
- 941 57th St Unit 3A
- 941 57th St Unit 1A
- 941 57th St Unit 4B
- 935 57th St Unit 4B
- 939 58th St
- 928 57th St Unit 3R
- 928 57th St Unit 2R
- 935 58th St
- 959 55th St
- 945 55th St
- 943 60th St Unit 4A
- 869 57th St Unit 205
- 864 56th St Unit 4C
- 864 56th St Unit 4B
- 864 56th St Unit 4A
- 867 56th St
- 915 60th St
- 860 56th St
- 975 57th St
- 981 57th St
- 971 57th St
- 983 57th St
- 969 57th St
- 5612 Fort Hamilton Pkwy
- 5610 Fort Hamilton Pkwy
- 965 57th St
- 978 56th St
- 976 56th St
- 5608 Fort Hamilton Pkwy
- 972 56th St
- 970 56th St
- 963 57th St
- 5606 Fort Hamilton Pkwy
- 966 56th St
- 5604 Fort Hamilton Pkwy
- 959 57th St
- 964 56th St
- 5602 Fort Hamilton Pkwy
Your Personal Tour Guide
Ask me questions while you tour the home.