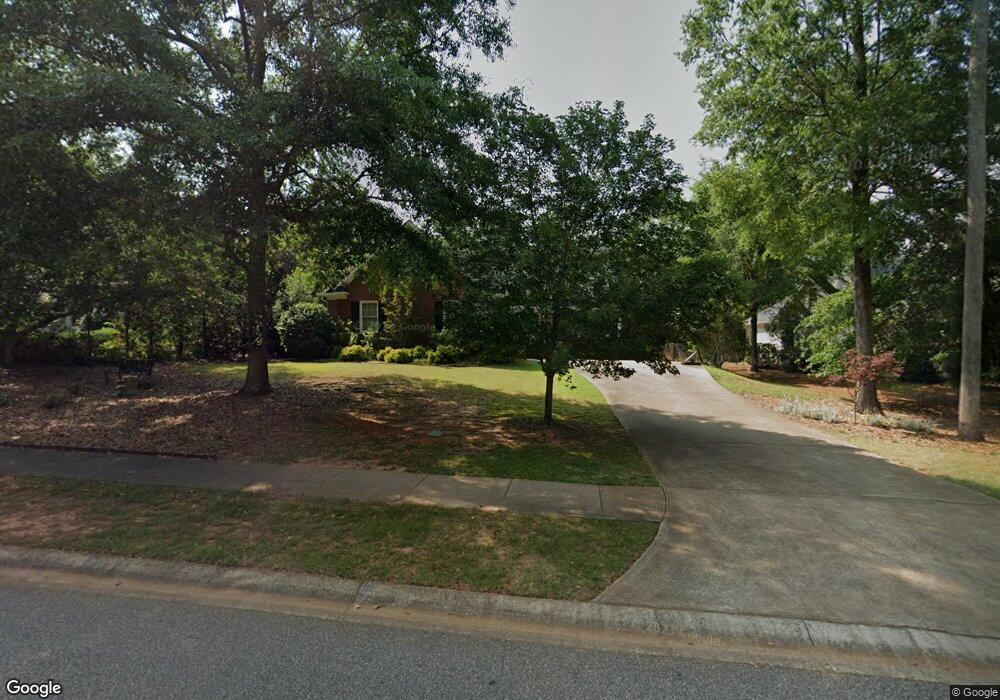
977 Saye Creek Dr Madison, GA 30650
Estimated Value: $778,000 - $1,023,000
4
Beds
4
Baths
3,800
Sq Ft
$231/Sq Ft
Est. Value
About This Home
This home is located at 977 Saye Creek Dr, Madison, GA 30650 and is currently estimated at $879,411, approximately $231 per square foot. 977 Saye Creek Dr is a home located in Morgan County with nearby schools including Morgan County Primary School, Morgan County Elementary School, and Morgan County Middle School.
Ownership History
Date
Name
Owned For
Owner Type
Purchase Details
Closed on
Oct 25, 2012
Sold by
Aiken Tracy Walker
Bought by
Heppner Zachary S and Heppner Whitney L
Current Estimated Value
Home Financials for this Owner
Home Financials are based on the most recent Mortgage that was taken out on this home.
Original Mortgage
$306,450
Outstanding Balance
$212,063
Interest Rate
3.42%
Mortgage Type
VA
Estimated Equity
$667,348
Purchase Details
Closed on
Mar 12, 2012
Sold by
Aiken Robert W
Bought by
Aiken Tracy Walker
Purchase Details
Closed on
Jun 21, 2005
Sold by
Aiken Robert W
Bought by
Aiken Robert W
Purchase Details
Closed on
Mar 3, 2005
Sold by
Aiken Robert W
Bought by
Walker Aiken Robert W and Walker Alken Tracey
Purchase Details
Closed on
Feb 17, 2003
Sold by
Aiken Robert W
Bought by
Aiken Robert W
Purchase Details
Closed on
Jan 7, 2002
Sold by
College Drive Partners Llc
Bought by
Planeview Partners Inc
Create a Home Valuation Report for This Property
The Home Valuation Report is an in-depth analysis detailing your home's value as well as a comparison with similar homes in the area
Home Values in the Area
Average Home Value in this Area
Purchase History
| Date | Buyer | Sale Price | Title Company |
|---|---|---|---|
| Heppner Zachary S | $300,000 | -- | |
| Aiken Tracy Walker | -- | -- | |
| Aiken Robert W | -- | -- | |
| Walker Aiken Robert W | -- | -- | |
| Aiken Robert W | -- | -- | |
| Aiken Robert W | $54,900 | -- | |
| Planeview Partners Inc | $22,200 | -- |
Source: Public Records
Mortgage History
| Date | Status | Borrower | Loan Amount |
|---|---|---|---|
| Open | Heppner Zachary S | $306,450 |
Source: Public Records
Tax History Compared to Growth
Tax History
| Year | Tax Paid | Tax Assessment Tax Assessment Total Assessment is a certain percentage of the fair market value that is determined by local assessors to be the total taxable value of land and additions on the property. | Land | Improvement |
|---|---|---|---|---|
| 2024 | $6,694 | $238,194 | $50,000 | $188,194 |
| 2023 | $5,937 | $205,249 | $34,000 | $171,249 |
| 2022 | $5,653 | $188,336 | $32,000 | $156,336 |
| 2021 | $5,507 | $182,736 | $26,400 | $156,336 |
| 2020 | $5,082 | $166,987 | $26,400 | $140,587 |
| 2019 | $4,900 | $158,519 | $25,200 | $133,319 |
| 2018 | $4,967 | $158,519 | $25,200 | $133,319 |
| 2017 | $4,952 | $155,654 | $25,200 | $130,454 |
| 2016 | $4,698 | $144,190 | $25,200 | $118,990 |
| 2015 | $4,976 | $150,680 | $20,000 | $130,680 |
| 2014 | $3,977 | $123,520 | $20,000 | $103,520 |
| 2013 | -- | $107,960 | $20,000 | $87,960 |
Source: Public Records
Map
Nearby Homes
- 962 Saye Creek Dr
- 943 Harper St
- 1027 Harper St
- 679 College Dr
- 1550 Athens Hwy
- 824 East Ave
- 766 East Ave
- 370 Park St Unit 8
- 1050 Madison Hills Dr Unit 2
- 1080 Madison Hills Dr
- 1040 Madison Hills Dr
- 1060 Madison Hills Dr
- 1040 Madison Hills Dr Unit 1
- 1060 Madison Hills Dr Unit 3
- 1080 Madison Hills Dr Unit 5
- 1355 Veranda Park Dr
- 1365 Veranda Park Dr
- 1698 Four Lakes Dr
- 172 N Second St
- 985 Saye Creek Dr
- 969 Saye Creek Dr
- 993 Saye Creek Dr
- 961 Saye Creek Dr
- 961 Saye Creek Dr Unit 1060 Jordan Road
- 952 Harper St
- 964 Harper St
- 978 Saye Creek Dr Unit 27
- 978 Saye Creek Dr
- 970 Saye Creek Dr
- 986 Saye Creek Dr
- 0 Saye Creek Dr Unit 8306952
- 0 Saye Creek Dr Unit 8255057
- 0 Saye Creek Dr Unit 8623169
- 0 Saye Creek Dr Unit 8521060
- 0 Saye Creek Dr Unit 7473269
- 0 Saye Creek Dr Unit 8535024
- 0 Saye Creek Dr Unit 8794805
- 0 Saye Creek Dr Unit 8796340
- 0 Saye Creek Dr Unit 2855352