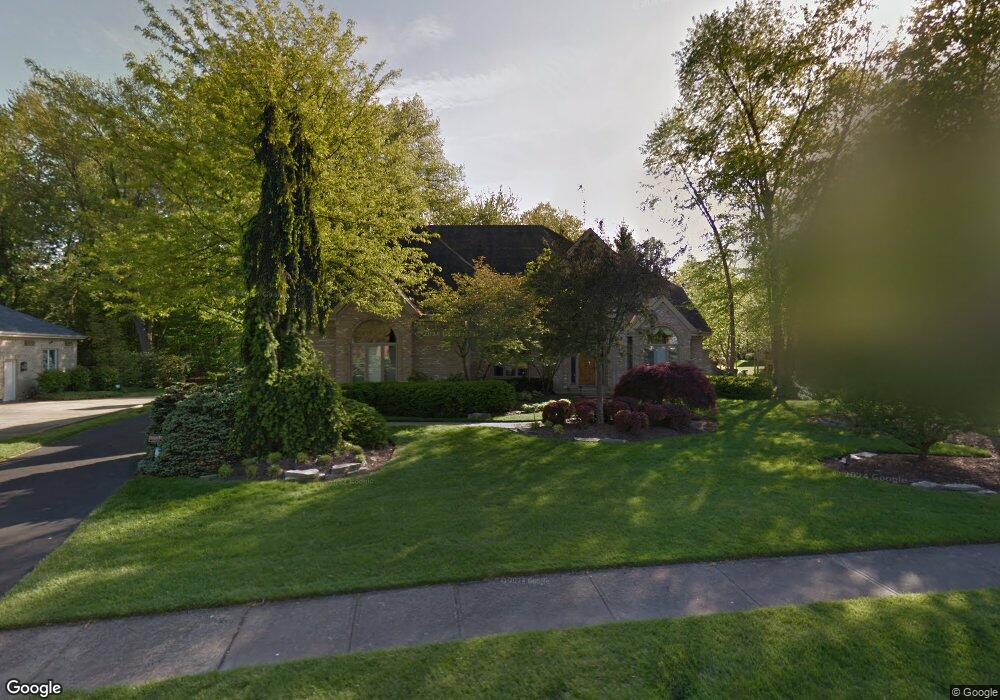
9771 Carriage Run Cir Loveland, OH 45140
Deerfield Township NeighborhoodEstimated Value: $771,960 - $955,000
4
Beds
6
Baths
4,730
Sq Ft
$180/Sq Ft
Est. Value
About This Home
This home is located at 9771 Carriage Run Cir, Loveland, OH 45140 and is currently estimated at $852,990, approximately $180 per square foot. 9771 Carriage Run Cir is a home located in Warren County with nearby schools including Kings Junior High School, Kings High School, and St. Margaret of York School.
Ownership History
Date
Name
Owned For
Owner Type
Purchase Details
Closed on
Jul 31, 2020
Sold by
Kirsh Gary M and Kirsh Nora H
Bought by
Wolkoff Michael A and Wolkoff Stefani
Current Estimated Value
Purchase Details
Closed on
Jul 9, 1991
Sold by
Jad-Cin & Inc
Bought by
Kirsh and Kirsh Gary M
Purchase Details
Closed on
Feb 15, 1991
Sold by
Village Associates & Inc
Bought by
Jad-Cin & Inc.
Purchase Details
Closed on
Jan 9, 1991
Sold by
Village Associates & Inc
Bought by
Village Associates & Inc
Create a Home Valuation Report for This Property
The Home Valuation Report is an in-depth analysis detailing your home's value as well as a comparison with similar homes in the area
Home Values in the Area
Average Home Value in this Area
Purchase History
| Date | Buyer | Sale Price | Title Company |
|---|---|---|---|
| Wolkoff Michael A | $560,000 | Parkway Title Llc | |
| Kirsh | $350,000 | -- | |
| Jad-Cin & Inc. | $53,000 | -- | |
| Village Associates & Inc | -- | -- |
Source: Public Records
Tax History Compared to Growth
Tax History
| Year | Tax Paid | Tax Assessment Tax Assessment Total Assessment is a certain percentage of the fair market value that is determined by local assessors to be the total taxable value of land and additions on the property. | Land | Improvement |
|---|---|---|---|---|
| 2024 | $11,634 | $224,400 | $31,500 | $192,900 |
| 2023 | $11,311 | $195,979 | $29,400 | $166,579 |
| 2022 | $11,135 | $195,979 | $29,400 | $166,579 |
| 2021 | $9,322 | $195,979 | $29,400 | $166,579 |
| 2020 | $9,692 | $171,483 | $24,500 | $146,983 |
| 2019 | $9,821 | $171,483 | $24,500 | $146,983 |
| 2018 | $9,800 | $171,483 | $24,500 | $146,983 |
| 2017 | $9,793 | $152,131 | $22,110 | $130,022 |
| 2016 | $10,044 | $152,131 | $22,110 | $130,022 |
| 2015 | $9,674 | $152,131 | $22,110 | $130,022 |
| 2014 | $9,674 | $152,130 | $22,110 | $130,020 |
| 2013 | $9,689 | $168,570 | $24,500 | $144,070 |
Source: Public Records
Map
Nearby Homes
- 9723 Carriage Run Ct
- 4230 Crestview Dr
- 4015 Oak Tree Ct
- 4198 Oak Tree Ct
- 3399 Shadow Ridge Dr
- 3393 Woodlake Ct
- 12061 Carrington Ln
- 12091 Carrington Ln
- 12041 Carrington Ln
- 310 Carrington Place
- 3291 Shadylake Dr
- 3230 Pauls Pointe Dr
- 410 Carrington Ln
- 3204 Dogwood Ct N
- 120 Carrington Ln
- 9989 Columbia Rd
- 110 Carrington Ln
- 3139 Dogwood Ct N
- 9530 Greenery Ct Unit 305C
- 220 Carrington Place
- 9771 Carriage Run Ct
- 9945 Carriage Run Cir
- 9781 Carriage Run Cir
- 9759 Carriage Run Cir
- 9759 Carriage Run Ct
- 3938 Timberwoods Ct
- 9762 Carriage Run Ct
- 9762 Carriage Run Cir
- 9776 Carriage Run Cir
- 9795 Carriage Run Cir
- 9795 Carriage Run Ct
- 9788 Carriage Run Cir
- 9788 Carriage Run Ct
- 9746 Carriage Run Cir
- 3950 Timberwoods Ct
- 3927 Timberwoods Ct
- 9800 Carriage Run Cir
- 9800 Carriage Run Ct
- 9805 Carriage Run Cir
- 9732 Carriage Run Ct