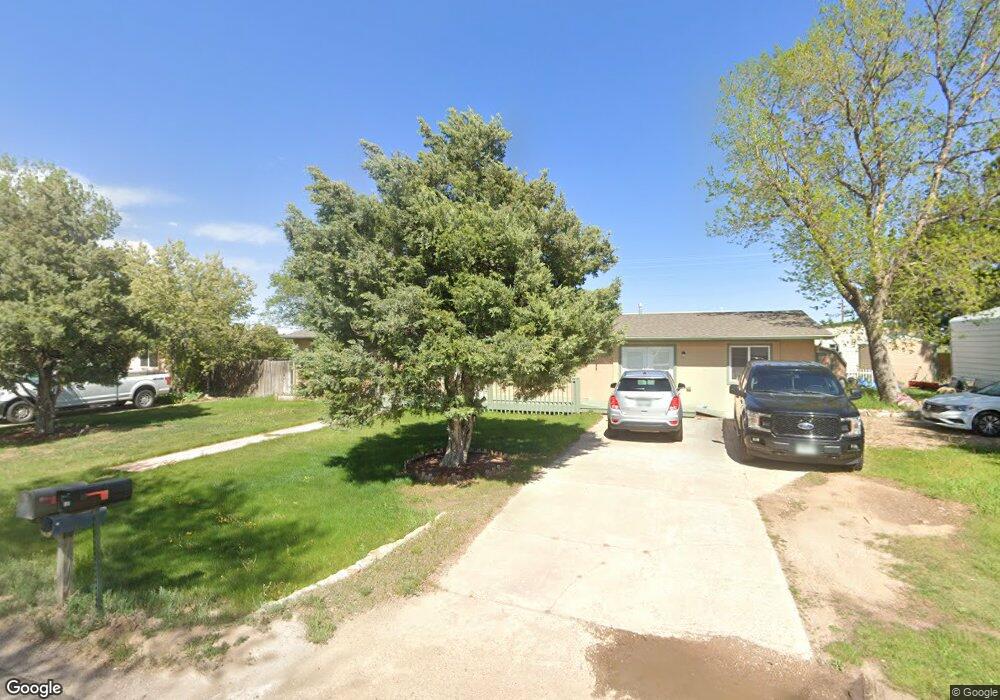
978 Boulder St Calhan, CO 80808
Estimated Value: $302,415 - $331,000
2
Beds
1
Bath
1,080
Sq Ft
$296/Sq Ft
Est. Value
About This Home
This home is located at 978 Boulder St, Calhan, CO 80808 and is currently estimated at $319,354, approximately $295 per square foot. 978 Boulder St is a home located in El Paso County with nearby schools including Calhan Elementary School, Calhan Middle School, and Calhan Secondary School.
Ownership History
Date
Name
Owned For
Owner Type
Purchase Details
Closed on
Mar 22, 2022
Sold by
Schmidt Dale E
Bought by
Schmidt William F and Schmidt Loretta
Current Estimated Value
Home Financials for this Owner
Home Financials are based on the most recent Mortgage that was taken out on this home.
Original Mortgage
$172,175
Outstanding Balance
$159,686
Interest Rate
3.76%
Mortgage Type
New Conventional
Estimated Equity
$159,668
Purchase Details
Closed on
Apr 16, 2018
Sold by
Schmidt Charlotte A
Bought by
Schmidt Charlotte A and Schmidt William F
Purchase Details
Closed on
Oct 24, 2014
Sold by
Schmidt Charlotte A
Bought by
Schmidt Charlotte A
Purchase Details
Closed on
Feb 12, 2009
Sold by
Lawson Dexter L and Lawson Carol A
Bought by
Schmidt Leroy W and Schmidt Charlotte A
Purchase Details
Closed on
May 15, 2001
Sold by
Beaman Dale P and Beaman Phyllis A
Bought by
Lawson Dexter L and Lawson Carol A
Home Financials for this Owner
Home Financials are based on the most recent Mortgage that was taken out on this home.
Original Mortgage
$94,000
Interest Rate
6.99%
Purchase Details
Closed on
Mar 1, 1963
Bought by
Schmidt Charlotte A
Create a Home Valuation Report for This Property
The Home Valuation Report is an in-depth analysis detailing your home's value as well as a comparison with similar homes in the area
Purchase History
| Date | Buyer | Sale Price | Title Company |
|---|---|---|---|
| Schmidt William F | -- | First American Title | |
| Schmidt Charlotte A | -- | None Available | |
| Schmidt Charlotte A | -- | None Available | |
| Schmidt Leroy W | $145,000 | Unified Title Company | |
| Lawson Dexter L | $117,500 | -- | |
| Schmidt Charlotte A | -- | -- |
Source: Public Records
Mortgage History
| Date | Status | Borrower | Loan Amount |
|---|---|---|---|
| Open | Schmidt William F | $172,175 | |
| Previous Owner | Lawson Dexter L | $94,000 |
Source: Public Records
Tax History
| Year | Tax Paid | Tax Assessment Tax Assessment Total Assessment is a certain percentage of the fair market value that is determined by local assessors to be the total taxable value of land and additions on the property. | Land | Improvement |
|---|---|---|---|---|
| 2025 | $1,248 | $21,530 | -- | -- |
| 2024 | $1,144 | $20,250 | $3,920 | $16,330 |
| 2022 | $901 | $11,790 | $2,710 | $9,080 |
| 2021 | $827 | $12,130 | $2,790 | $9,340 |
| 2020 | $705 | $10,170 | $1,860 | $8,310 |
| 2019 | $633 | $10,170 | $1,860 | $8,310 |
| 2018 | $593 | $9,320 | $1,870 | $7,450 |
| 2017 | $587 | $9,320 | $1,870 | $7,450 |
| 2016 | $600 | $9,530 | $1,970 | $7,560 |
| 2015 | $600 | $9,530 | $1,970 | $7,560 |
| 2014 | $567 | $10,060 | $1,970 | $8,090 |
Source: Public Records
Map
Nearby Homes
- 1049 Denver St
- 0000 Judge Orr Rd
- 548 Denver St
- 401 Cheyenne St
- 344 3rd St
- 12275 N Calhan Hwy
- 29440 Gardetto View
- 15530 Kanuch Rd
- 0 Tbd Soap Weed Rd
- 28510 Washington Rd
- Parcel 3 Barney Rd
- 13820 Noah Abel Point
- 28350 Washington Rd
- 18450 Eurich Rd
- 12625 Palomino Dr
- 10515 Currier Rd
- 24120 Palomino Cir
- 13731 N Ellicott Hwy
- 7492 Yoder Rd Unit 34
- 7252 Yoder Rd