978 Glenrock Dr Incline Village, NV 89451
Estimated Value: $866,088 - $947,000
3
Beds
3
Baths
1,440
Sq Ft
$621/Sq Ft
Est. Value
About This Home
This home is located at 978 Glenrock Dr, Incline Village, NV 89451 and is currently estimated at $894,022, approximately $620 per square foot. 978 Glenrock Dr is a home located in Washoe County with nearby schools including Incline Elementary School, Incline Middle School, and Incline High School.
Ownership History
Date
Name
Owned For
Owner Type
Purchase Details
Closed on
Aug 8, 2014
Sold by
Nibouar Douglas Edwin
Bought by
Chukhlebov Mikhall I and Chukhlebova Olga
Current Estimated Value
Home Financials for this Owner
Home Financials are based on the most recent Mortgage that was taken out on this home.
Original Mortgage
$262,800
Outstanding Balance
$200,459
Interest Rate
4.12%
Mortgage Type
New Conventional
Estimated Equity
$693,563
Purchase Details
Closed on
Mar 8, 2013
Sold by
Nibouar Douglas E
Bought by
Nibouar Douglas Edwin and The Douglas Edwin Nibouar Living Trust
Purchase Details
Closed on
Feb 23, 1996
Sold by
Nibour Kathleen L
Bought by
Nibour Douglas E
Purchase Details
Closed on
Jun 30, 1994
Sold by
Jann Shelton S and Jann Eunice
Bought by
Nibouar Douglas E and Nibouar Kathleen L
Home Financials for this Owner
Home Financials are based on the most recent Mortgage that was taken out on this home.
Original Mortgage
$101,808
Interest Rate
8.53%
Mortgage Type
Seller Take Back
Create a Home Valuation Report for This Property
The Home Valuation Report is an in-depth analysis detailing your home's value as well as a comparison with similar homes in the area
Home Values in the Area
Average Home Value in this Area
Purchase History
| Date | Buyer | Sale Price | Title Company |
|---|---|---|---|
| Chukhlebov Mikhall I | $328,500 | None Available | |
| Nibouar Douglas Edwin | -- | None Available | |
| Nibour Douglas E | -- | -- | |
| Nibouar Douglas E | $113,500 | Western Title Company Inc |
Source: Public Records
Mortgage History
| Date | Status | Borrower | Loan Amount |
|---|---|---|---|
| Open | Chukhlebov Mikhall I | $262,800 | |
| Previous Owner | Nibouar Douglas E | $101,808 |
Source: Public Records
Tax History Compared to Growth
Tax History
| Year | Tax Paid | Tax Assessment Tax Assessment Total Assessment is a certain percentage of the fair market value that is determined by local assessors to be the total taxable value of land and additions on the property. | Land | Improvement |
|---|---|---|---|---|
| 2025 | $2,282 | $92,186 | $68,530 | $23,656 |
| 2024 | $2,282 | $85,648 | $62,300 | $23,348 |
| 2023 | $1,762 | $81,638 | $60,025 | $21,613 |
| 2022 | $2,351 | $69,573 | $50,855 | $18,718 |
| 2021 | $2,235 | $51,862 | $33,880 | $17,982 |
| 2020 | $2,197 | $51,285 | $33,880 | $17,405 |
| 2019 | $2,132 | $46,648 | $29,295 | $17,353 |
| 2018 | $2,072 | $38,693 | $21,245 | $17,448 |
| 2017 | $2,022 | $39,026 | $21,175 | $17,851 |
| 2016 | $1,992 | $37,764 | $18,900 | $18,864 |
| 2015 | $1,990 | $33,554 | $15,225 | $18,329 |
| 2014 | $2,005 | $36,711 | $17,745 | $18,966 |
| 2013 | -- | $33,169 | $14,000 | $19,169 |
Source: Public Records
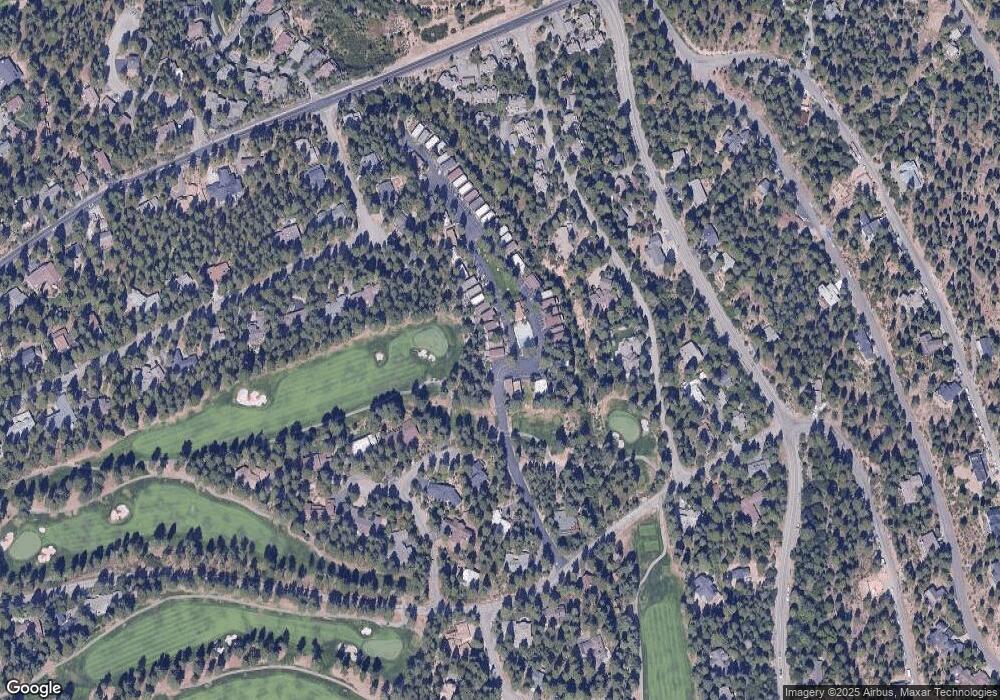
Map
Nearby Homes
- 978 Glenrock Dr Unit 45
- 978 Glenrock Dr Unit 13
- 654 Country Club Dr
- 696 Village Blvd Unit 24
- 696 Village Blvd Unit 12
- 696 Village Blvd Unit 20
- 976 Caddie Ct
- 898 Peepsight Cir Unit 27B
- 647 Village Blvd Unit 3
- 577 Eagle Dr
- 770 Golfers Pass Rd
- 575 Fairview Blvd
- 517 Driver Way
- 844 Lichen Ct
- 725 Fairview Blvd Unit 11
- 725 Fairview Blvd Unit 40
- 954 Fairway Blvd Unit 4
- 908 Harold Dr Unit 23
- 908 Harold Dr Unit 18
- 908 Harold Dr Unit 38
- 978 Glenrock Dr
- 978 Glenrock Dr
- 978 Glenrock Dr
- 978 Glenrock Dr
- 978 Glenrock Dr
- 978 Glenrock Dr
- 978 Glenrock Dr
- 978 Glenrock Dr
- 978 Glenrock Dr
- 978 Glenrock Dr
- 978 Glenrock Dr
- 978 Glenrock Dr
- 978 Glenrock Dr
- 978 Glenrock Dr
- 978 Glenrock Dr
- 978 Glenrock Dr
- 978 Glenrock Dr
- 978 Glenrock Dr
- 978 Glenrock Dr
- 978 Glenrock Dr