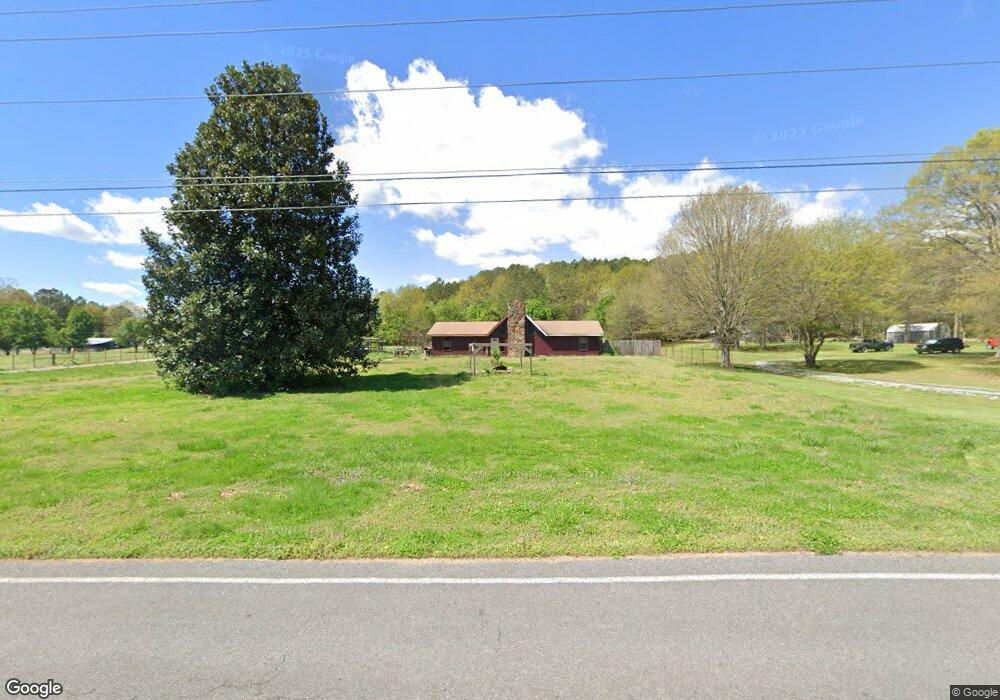
978 Harris Beamer Rd SW Calhoun, GA 30701
Estimated Value: $235,000 - $298,000
3
Beds
2
Baths
1,853
Sq Ft
$149/Sq Ft
Est. Value
About This Home
This home is located at 978 Harris Beamer Rd SW, Calhoun, GA 30701 and is currently estimated at $275,567, approximately $148 per square foot. 978 Harris Beamer Rd SW is a home located in Gordon County with nearby schools including Swain Elementary School, Ashworth Middle School, and Gordon Central High School.
Ownership History
Date
Name
Owned For
Owner Type
Purchase Details
Closed on
May 11, 2007
Sold by
Beck Sandra C
Bought by
Melton Deanna
Current Estimated Value
Home Financials for this Owner
Home Financials are based on the most recent Mortgage that was taken out on this home.
Original Mortgage
$79,800
Outstanding Balance
$48,540
Interest Rate
6.17%
Mortgage Type
New Conventional
Estimated Equity
$227,027
Purchase Details
Closed on
Jun 24, 2003
Sold by
Deutsche Bank National Trust C
Bought by
Beck Sandra C
Purchase Details
Closed on
Mar 4, 2003
Sold by
Ward Issaac V
Bought by
Deutsche Bank National Trust Co
Purchase Details
Closed on
Jun 14, 2000
Sold by
Secretary Of Veterans Affair
Bought by
Ward Issaac V
Purchase Details
Closed on
Jan 4, 2000
Bought by
Secretary Of Veterans Affair
Purchase Details
Closed on
Apr 28, 1997
Bought by
Herron Bruce H and Herron Tracye L
Create a Home Valuation Report for This Property
The Home Valuation Report is an in-depth analysis detailing your home's value as well as a comparison with similar homes in the area
Home Values in the Area
Average Home Value in this Area
Purchase History
| Date | Buyer | Sale Price | Title Company |
|---|---|---|---|
| Melton Deanna | $101,000 | -- | |
| Beck Sandra C | $81,000 | -- | |
| Deutsche Bank National Trust Co | -- | -- | |
| Ward Issaac V | -- | -- | |
| Secretary Of Veterans Affair | -- | -- | |
| Norwest Mrtgage Inc A Ca Cor | $84,100 | -- | |
| Herron Bruce H | $85,000 | -- |
Source: Public Records
Mortgage History
| Date | Status | Borrower | Loan Amount |
|---|---|---|---|
| Open | Melton Deanna | $79,800 |
Source: Public Records
Tax History Compared to Growth
Tax History
| Year | Tax Paid | Tax Assessment Tax Assessment Total Assessment is a certain percentage of the fair market value that is determined by local assessors to be the total taxable value of land and additions on the property. | Land | Improvement |
|---|---|---|---|---|
| 2024 | $1,483 | $58,372 | $7,560 | $50,812 |
| 2023 | $1,352 | $55,212 | $7,560 | $47,652 |
| 2022 | $1,356 | $52,212 | $7,560 | $44,652 |
| 2021 | $1,160 | $43,412 | $7,560 | $35,852 |
| 2020 | $1,178 | $43,132 | $7,560 | $35,572 |
| 2019 | $1,185 | $43,132 | $7,560 | $35,572 |
| 2018 | $1,123 | $40,972 | $7,560 | $33,412 |
| 2017 | $1,100 | $39,132 | $7,560 | $31,572 |
| 2016 | $1,103 | $39,132 | $7,560 | $31,572 |
| 2015 | $1,095 | $38,532 | $7,560 | $30,972 |
| 2014 | $1,052 | $38,142 | $7,594 | $30,548 |
Source: Public Records
Map
Nearby Homes
- The Braselton II Plan at Fair Oak
- The Reynolds Plan at Fair Oak
- The Buford II Plan at Fair Oak
- The Lawson Plan at Fair Oak
- The Caldwell Plan at Fair Oak
- The Benson II Plan at Fair Oak
- The Greenbrier II Plan at Fair Oak
- 176 Village Way SW
- 210 Madison Dr SW
- 413 Beamer Rd SW
- 130 Brookstone Dr SW
- 137 Regency Row SW
- 215 Wilson St
- 515 Hunt Bend Rd NW
- 227 Mcconnell Rd
- 121 Foxhall Dr SW
- 100 Neal St
- 2108 Roland Hayes Pkwy SW
- 153 Riverview Dr
- 404 Mcginnis Cir
- 1004 Harris Beamer Rd SW
- 117 Luke St SW
- 148 Luke St SW
- 1020 Harris Beamer Rd SW
- 107 Koufax Dr SW
- 109 Koufax Dr SW
- 105 Koufax Dr SW
- 926 Harris Beamer Rd SW
- 958 Harris Beamer Rd SW
- 115 Levi St SW Unit 35
- 115 Levi St SW
- 164 Luke St SW
- 125 Levi St SW
- 139 Levi St SW
- 134 Levi St SW
- 790 Harris Beamer Rd SW
- 1072 Harris Beamer Rd SW
- 1063 Harris Beamer Rd SW
- 0 Luke Unit 4283680
- 148 Levi St SW