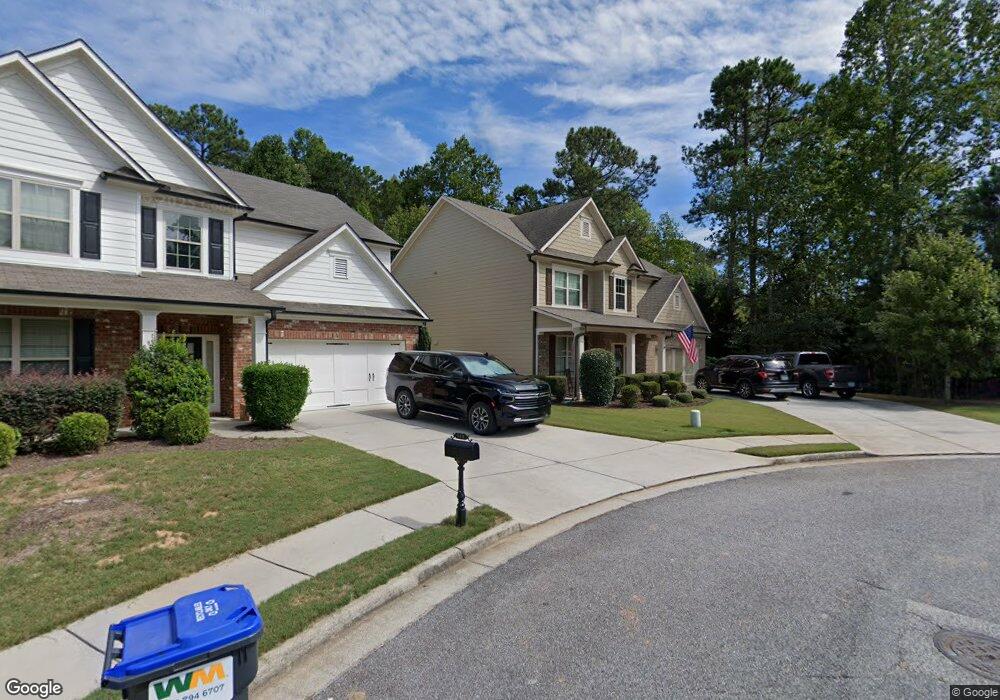
978 Upland Ives Dr Sugar Hill, GA 30518
Estimated Value: $437,000 - $485,000
4
Beds
3
Baths
2,490
Sq Ft
$184/Sq Ft
Est. Value
About This Home
This home is located at 978 Upland Ives Dr, Sugar Hill, GA 30518 and is currently estimated at $459,396, approximately $184 per square foot. 978 Upland Ives Dr is a home with nearby schools including Sycamore Elementary School, Lanier Middle School, and Lanier High School.
Ownership History
Date
Name
Owned For
Owner Type
Purchase Details
Closed on
Jul 27, 2018
Sold by
Lorentz Kelly C
Bought by
Clark David T and Clark Courtney B
Current Estimated Value
Home Financials for this Owner
Home Financials are based on the most recent Mortgage that was taken out on this home.
Original Mortgage
$280,912
Outstanding Balance
$242,942
Interest Rate
4.5%
Estimated Equity
$216,454
Purchase Details
Closed on
Oct 5, 2012
Sold by
Southern Heritage Builders
Bought by
Lorentz Kelly C and Lorentz Meredith D
Home Financials for this Owner
Home Financials are based on the most recent Mortgage that was taken out on this home.
Original Mortgage
$176,641
Interest Rate
3.75%
Mortgage Type
FHA
Purchase Details
Closed on
Jul 24, 2012
Sold by
Jkb Capital Llc
Bought by
Southern Heritage Home Builder
Home Financials for this Owner
Home Financials are based on the most recent Mortgage that was taken out on this home.
Original Mortgage
$116,200
Interest Rate
3.68%
Mortgage Type
New Conventional
Purchase Details
Closed on
Apr 19, 2012
Sold by
Austin Garner Llc
Bought by
Jkb Capital Llc
Create a Home Valuation Report for This Property
The Home Valuation Report is an in-depth analysis detailing your home's value as well as a comparison with similar homes in the area
Home Values in the Area
Average Home Value in this Area
Purchase History
| Date | Buyer | Sale Price | Title Company |
|---|---|---|---|
| Clark David T | $275,000 | -- | |
| Lorentz Kelly C | $179,900 | -- | |
| Southern Heritage Home Builder | $50,000 | -- | |
| Jkb Capital Llc | $40,000 | -- |
Source: Public Records
Mortgage History
| Date | Status | Borrower | Loan Amount |
|---|---|---|---|
| Open | Clark David T | $280,912 | |
| Previous Owner | Lorentz Kelly C | $176,641 | |
| Previous Owner | Southern Heritage Home Builder | $116,200 |
Source: Public Records
Tax History Compared to Growth
Tax History
| Year | Tax Paid | Tax Assessment Tax Assessment Total Assessment is a certain percentage of the fair market value that is determined by local assessors to be the total taxable value of land and additions on the property. | Land | Improvement |
|---|---|---|---|---|
| 2025 | $724 | $201,320 | $40,000 | $161,320 |
| 2024 | $5,004 | $180,400 | $30,800 | $149,600 |
| 2023 | $5,004 | $180,400 | $30,800 | $149,600 |
| 2022 | $4,555 | $157,800 | $24,000 | $133,800 |
| 2021 | $3,643 | $110,000 | $20,000 | $90,000 |
| 2020 | $4,135 | $110,000 | $20,000 | $90,000 |
| 2019 | $4,002 | $110,000 | $20,000 | $90,000 |
| 2018 | $3,461 | $105,480 | $20,000 | $85,480 |
| 2016 | $3,074 | $90,240 | $16,000 | $74,240 |
| 2015 | $2,914 | $82,880 | $16,000 | $66,880 |
| 2014 | -- | $82,880 | $16,000 | $66,880 |
Source: Public Records
Map
Nearby Homes
- 598 Austin Creek Dr
- 5730 Arbor Green Cir
- 6377 Barker Station Walk NE
- 778 Austin Creek Dr
- 915 Riverside Rd Unit 3
- 6417 Barker Station Walk
- 5671 Arbor Green Cir
- 5840 Stephens Mill Dr
- 6897 Barker Station Walk
- 6737 Barker Station Walk
- 818 Pond View Ct
- 5683 Riverside Walk Dr
- 5680 Princeton Oaks Dr
- 5650 Princeton Oaks Dr
- 821 Sapphire Ln
- 6458 Pierless Ave NE
- 968 Upland Ives Dr
- 907 Upland Ct
- 907 Upland Ct
- 917 Upland Ct
- 928 Upland Ct
- 927 Upland Ct
- 5905 Austin Garner Rd
- 961 Upland Ives Dr
- 971 Upland Ives Dr
- 937 Upland Ct
- 951 Upland Ives Dr
- 941 Upland Ives Dr
- 947 Upland Ct
- 938 Upland Ives Dr
- 938 Upland Ives Dr Unit 34
- 0 Upland Ct NE Unit 7199830
- 0 Upland Ct NE Unit 7145254
- 0 Upland Ct NE Unit 7100601
- 0 Upland Ct NE Unit 7044189
- 0 Upland Ct NE Unit 8745583