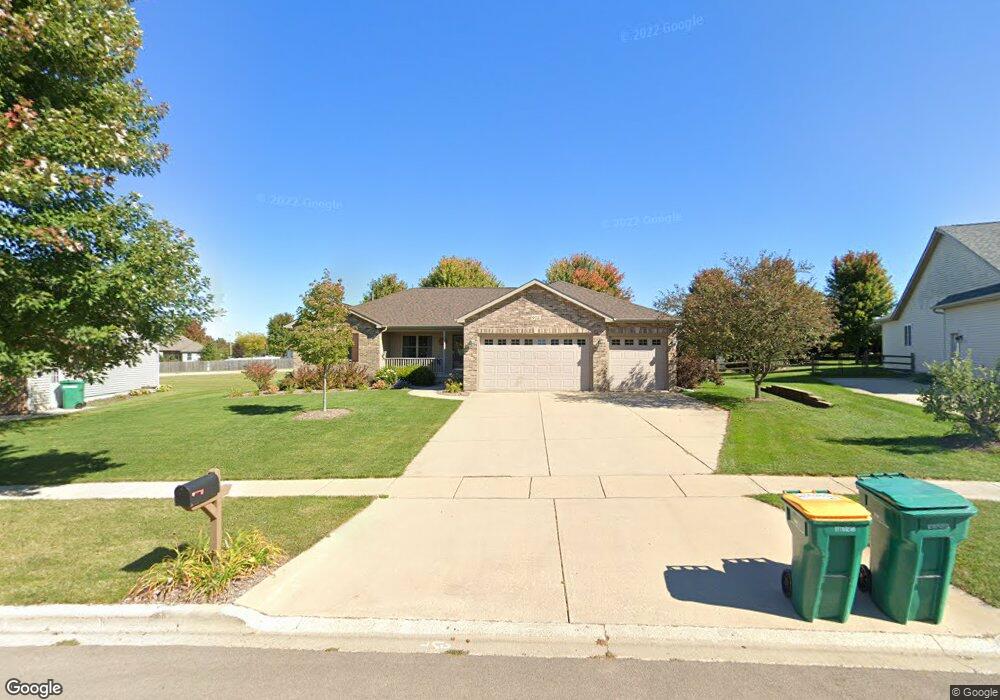
978 Wells Dr Sycamore, IL 60178
Estimated Value: $432,000 - $494,000
3
Beds
2
Baths
1,964
Sq Ft
$235/Sq Ft
Est. Value
About This Home
This home is located at 978 Wells Dr, Sycamore, IL 60178 and is currently estimated at $461,992, approximately $235 per square foot. 978 Wells Dr is a home located in DeKalb County with nearby schools including Sycamore High School, St Mary's Catholic School, and Cornerstone Christian Academy.
Ownership History
Date
Name
Owned For
Owner Type
Purchase Details
Closed on
Dec 1, 2022
Sold by
Zang Michael G and Zang Donna J
Bought by
Zang Trust
Current Estimated Value
Purchase Details
Closed on
Jul 21, 2014
Sold by
Stewart Joseph J
Bought by
Zang Michael G and Zang Donna J
Home Financials for this Owner
Home Financials are based on the most recent Mortgage that was taken out on this home.
Original Mortgage
$105,000
Interest Rate
4.12%
Mortgage Type
New Conventional
Purchase Details
Closed on
Aug 29, 2007
Sold by
Jc Farley General Contractor
Bought by
Stewart Joseph and Stewart Kelly
Home Financials for this Owner
Home Financials are based on the most recent Mortgage that was taken out on this home.
Original Mortgage
$129,000
Interest Rate
6.79%
Mortgage Type
New Conventional
Purchase Details
Closed on
Apr 5, 2006
Sold by
American Natl Bank Dekalb
Bought by
Jc Farley General Contractor
Create a Home Valuation Report for This Property
The Home Valuation Report is an in-depth analysis detailing your home's value as well as a comparison with similar homes in the area
Home Values in the Area
Average Home Value in this Area
Purchase History
| Date | Buyer | Sale Price | Title Company |
|---|---|---|---|
| Zang Trust | -- | -- | |
| Zang Michael G | $245,000 | -- | |
| Stewart Joseph | $307,000 | -- | |
| Jc Farley General Contractor | $73,000 | -- |
Source: Public Records
Mortgage History
| Date | Status | Borrower | Loan Amount |
|---|---|---|---|
| Previous Owner | Zang Michael G | $105,000 | |
| Previous Owner | Stewart Joseph | $129,000 |
Source: Public Records
Tax History Compared to Growth
Tax History
| Year | Tax Paid | Tax Assessment Tax Assessment Total Assessment is a certain percentage of the fair market value that is determined by local assessors to be the total taxable value of land and additions on the property. | Land | Improvement |
|---|---|---|---|---|
| 2024 | $8,647 | $124,900 | $21,001 | $103,899 |
| 2023 | $8,647 | $106,591 | $17,922 | $88,669 |
| 2022 | $8,223 | $97,763 | $16,438 | $81,325 |
| 2021 | $7,794 | $91,779 | $15,432 | $76,347 |
| 2020 | $7,672 | $89,523 | $15,053 | $74,470 |
| 2019 | $7,284 | $87,561 | $14,723 | $72,838 |
| 2018 | $7,363 | $87,118 | $19,054 | $68,064 |
| 2017 | $7,160 | $83,671 | $18,300 | $65,371 |
| 2016 | $6,960 | $79,854 | $17,465 | $62,389 |
| 2015 | -- | $73,017 | $16,438 | $56,579 |
| 2014 | -- | $69,335 | $15,609 | $53,726 |
| 2013 | -- | $70,663 | $15,908 | $54,755 |
Source: Public Records
Map
Nearby Homes
- 1120 Oxford Cir
- 1310 Arneita St
- 1152 Rose Dr
- 45 Briden Ln Unit 45
- 56 Briden Ln Unit 56
- 44 Kloe Ln Unit 44
- 60 Kloe Ln Unit 60
- 64 Kloe Ln Unit 64
- TBD Bethany Rd
- TBD Plaza Dr
- TBD Aberdeen Ct
- TBD Peace Rd
- 434 E Exchange St Unit 2
- 321 N Locust St
- 459 E State St
- 335 North Ave
- 495 John Marshall Ln
- 1936 Galloway Ct
- 1929 Galloway Ct
- Lot 1 Route 23