Estimated Value: $372,000 - $398,650
4
Beds
3
Baths
2,112
Sq Ft
$184/Sq Ft
Est. Value
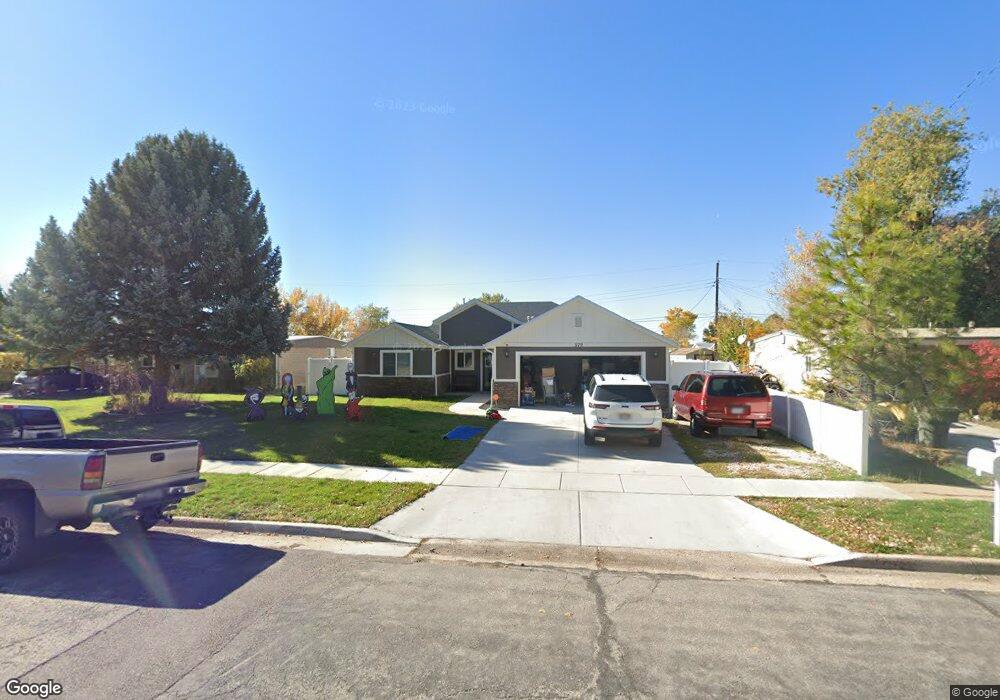
About This Home
This home is located at 979 N Jefferson Ave, Ogden, UT 84404 and is currently estimated at $387,663, approximately $183 per square foot. 979 N Jefferson Ave is a home located in Weber County with nearby schools including Lincoln School, Highland Junior High School, and Ben Lomond High School.
Ownership History
Date
Name
Owned For
Owner Type
Purchase Details
Closed on
Apr 25, 2022
Sold by
Arrington and Nathan
Bought by
Totman Ryan
Current Estimated Value
Home Financials for this Owner
Home Financials are based on the most recent Mortgage that was taken out on this home.
Original Mortgage
$300,000
Outstanding Balance
$280,581
Interest Rate
3.85%
Mortgage Type
New Conventional
Estimated Equity
$107,082
Purchase Details
Closed on
Apr 15, 2020
Sold by
Wiesen Christine and Wiesen Angela K
Bought by
Arrington Brinlee and Arrington Nathan
Home Financials for this Owner
Home Financials are based on the most recent Mortgage that was taken out on this home.
Original Mortgage
$220,190
Interest Rate
3.6%
Mortgage Type
New Conventional
Purchase Details
Closed on
May 11, 2018
Sold by
Richardson Paula M and Richardson Paul H
Bought by
Wiesen Christine and Wiesen Angela K Linza
Home Financials for this Owner
Home Financials are based on the most recent Mortgage that was taken out on this home.
Original Mortgage
$190,944
Interest Rate
4.4%
Mortgage Type
VA
Purchase Details
Closed on
Sep 20, 2016
Sold by
Orquiz Paula M
Bought by
Richardson Paula M and Richardson Paul H
Purchase Details
Closed on
Oct 26, 2010
Sold by
Federal Home Loan Mortgage Corporation
Bought by
Orquiz Paula M
Home Financials for this Owner
Home Financials are based on the most recent Mortgage that was taken out on this home.
Original Mortgage
$92,651
Interest Rate
4.33%
Mortgage Type
FHA
Purchase Details
Closed on
Jul 28, 2006
Sold by
Epps Ray and Castle Spencer
Bought by
Nunez Dorian and Santos Jorge
Purchase Details
Closed on
Nov 28, 2005
Sold by
Shupe Scott
Bought by
Epps Ray and Castle Spencer
Home Financials for this Owner
Home Financials are based on the most recent Mortgage that was taken out on this home.
Original Mortgage
$47,312
Interest Rate
6.14%
Mortgage Type
Purchase Money Mortgage
Purchase Details
Closed on
Feb 13, 2001
Sold by
Direct Investors Lc
Bought by
Shupe Scott
Purchase Details
Closed on
Sep 2, 1998
Sold by
Shupe Scott
Bought by
Direct Investors Lc
Home Financials for this Owner
Home Financials are based on the most recent Mortgage that was taken out on this home.
Original Mortgage
$106,250
Interest Rate
6.92%
Mortgage Type
Seller Take Back
Purchase Details
Closed on
Aug 28, 1998
Sold by
Direct Investors Lc
Bought by
Shupe Scott
Home Financials for this Owner
Home Financials are based on the most recent Mortgage that was taken out on this home.
Original Mortgage
$106,250
Interest Rate
6.92%
Mortgage Type
Seller Take Back
Create a Home Valuation Report for This Property
The Home Valuation Report is an in-depth analysis detailing your home's value as well as a comparison with similar homes in the area
Home Values in the Area
Average Home Value in this Area
Purchase History
| Date | Buyer | Sale Price | Title Company |
|---|---|---|---|
| Totman Ryan | -- | Homie Title | |
| Arrington Brinlee | -- | Backman Ntp | |
| Wiesen Christine | -- | Intrermountian Title Ins & E | |
| Richardson Paula M | -- | None Available | |
| Orquiz Paula M | -- | Bonneville Superior Title Co | |
| Nunez Dorian | -- | Backman | |
| Epps Ray | -- | Metro National Title Ogden | |
| Shupe Scott | -- | -- | |
| Direct Investors Lc | -- | -- | |
| Shupe Scott | -- | -- | |
| Direct Investors Lc | -- | -- |
Source: Public Records
Mortgage History
| Date | Status | Borrower | Loan Amount |
|---|---|---|---|
| Open | Totman Ryan | $300,000 | |
| Previous Owner | Arrington Brinlee | $220,190 | |
| Previous Owner | Wiesen Christine | $190,944 | |
| Previous Owner | Orquiz Paula M | $92,651 | |
| Previous Owner | Epps Ray | $47,312 | |
| Previous Owner | Direct Investors Lc | $106,250 | |
| Previous Owner | Shupe Scott | $106,250 |
Source: Public Records
Tax History
| Year | Tax Paid | Tax Assessment Tax Assessment Total Assessment is a certain percentage of the fair market value that is determined by local assessors to be the total taxable value of land and additions on the property. | Land | Improvement |
|---|---|---|---|---|
| 2025 | $2,801 | $410,601 | $105,015 | $305,586 |
| 2024 | $2,633 | $208,449 | $57,758 | $150,691 |
| 2023 | $2,526 | $201,300 | $52,164 | $149,136 |
| 2022 | $2,657 | $212,300 | $44,002 | $168,298 |
| 2021 | $1,598 | $211,954 | $50,052 | $161,902 |
| 2020 | $1,665 | $204,000 | $39,987 | $164,013 |
| 2019 | $1,556 | $179,000 | $30,057 | $148,943 |
| 2018 | $1,295 | $148,000 | $26,008 | $121,992 |
| 2017 | $1,106 | $118,000 | $26,008 | $91,992 |
| 2016 | $970 | $55,963 | $11,909 | $44,054 |
| 2015 | $905 | $50,942 | $11,909 | $39,033 |
| 2014 | $921 | $50,942 | $10,429 | $40,513 |
Source: Public Records
Map
Nearby Homes
- 976 N Jefferson Ave
- 1001 N 550 E Unit 98
- 1010 N 525 E Unit 90
- 1020 N 525 E Unit 91
- 526 E 980 N Unit 62
- 1031 N 525 E Unit 85
- 511 E 950 N Unit 34
- 1116 N Jefferson Ave
- 461 E 960 N
- 1013 N 450 St E Unit 60
- 965 N Liberty Ave
- 602 Ridge Place Dr
- 448 E 900 N Unit 6
- 652 E 1225 N
- 835 N Washington Blvd Unit 1,2
- 826 E 760 N
- 824 E 760 N
- 872 E 1100 N
- 827 E 760 N
- 278 E Larsen Ln
- 967 N Jefferson Ave
- 987 N Jefferson Ave
- 955 N Jefferson Ave
- 1005 N Jefferson Ave
- 558 E 980 N Unit 68
- 956 N 550 E Unit 25
- 956 N 550 E
- 950 N 550 E Unit 24
- 968 N Jefferson Ave
- 552 E 980 N Unit 67
- 988 N Jefferson Ave
- 1019 N Jefferson Ave
- 941 N Jefferson Ave
- 956 N Jefferson Ave
- 547 E 980 N Unit 2-049
- 960 N 550 E Unit 27
- 960 N 550 E
- 1006 N Jefferson Ave
- 550 E 980 N
- 1000 N 550 E Unit 99
Your Personal Tour Guide
Ask me questions while you tour the home.