J
Seller's Agent in 2016
Jessica Owens
Re/Max Of Albany

Estimated Value: $361,343 - $497,000
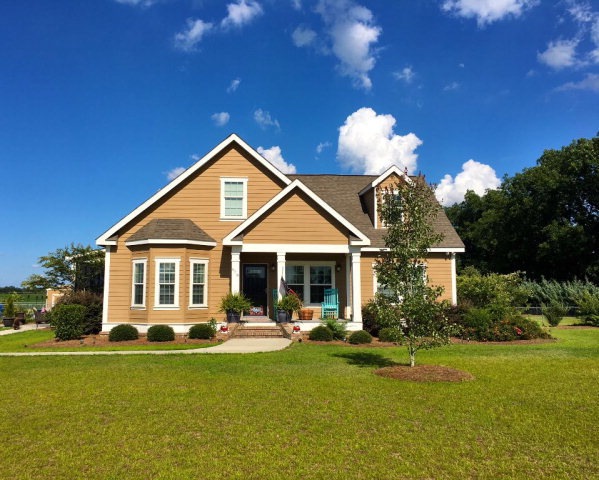
WOW Worth County custom home w/almost 3000 sq.ft. 4BR 3 full baths, salt water pool, screened porch, storage building & lean-too & a 30x30 steel shop w/roll up door just to name a few of the amenities. This gorgeous custom home boasts hand scraped hardwood floors w/ an open concept split floor plan design, gorgeous stair case w/iron railing, 2 downstairs guest bedrooms w/HUGE closets & share a full bathroom. Spacious great room open to the kitchen w/custom cabinets, stainless appliances, bar top w/solid surface countertops, wet bar, tons of storage w/a gorgeous custom wooden venthood. Formal dining room and spacious laundry with entry from screened porch. HUGE downstairs master w/sitting area, large walk-in & LUXURY on suite master bath w/an arched tiled shower w/double valves, double vanities and custom cabinets. Upstairs 4th BR or bonus w/private full bath. Salt water pool, playhouse, irrigation, all rounded edges on interior walls & arches, custom everything! Please See Pics!
Last Agent to Sell the Property
Jessica Owens
Re/Max Of Albany Brokerage Phone: 2294341600 Listed on: 09/06/2016
Last Buyer's Agent
Jessica Owens
Re/Max Of Albany Brokerage Phone: 2294341600 Listed on: 09/06/2016
We collect this data history from publicly available records. To have your information removed, we recommend requesting removal directly through your county’s website.
| Date | Buyer | Sale Price | Title Company |
|---|---|---|---|
| Chapman Courtney M | -- | -- | |
| Chapman Courtney M | $233,000 | -- | |
| Hembree Jordan John | -- | -- | |
| Hembree Jordan John | $5,000 | -- |
We collect this data history from publicly available records. To have your information removed, we recommend requesting removal directly through your county’s website.
| Date | Status | Borrower | Loan Amount |
|---|---|---|---|
| Previous Owner | Chapman Courtney M | $215,710 |
| Date | Event | Price | List to Sale | Price per Sq Ft |
|---|---|---|---|---|
| 10/28/2016 10/28/16 | Sold | $233,000 | -- | $84 / Sq Ft |
| 09/06/2016 09/06/16 | Pending | -- | -- | -- |
| Year | Tax Paid | Tax Assessment Tax Assessment Total Assessment is a certain percentage of the fair market value that is determined by local assessors to be the total taxable value of land and additions on the property. | Land | Improvement |
|---|---|---|---|---|
| 2025 | $3,024 | $127,458 | $6,000 | $121,458 |
| 2024 | $2,463 | $76,991 | $6,000 | $70,991 |
| 2023 | $2,463 | $75,627 | $6,000 | $69,627 |
| 2022 | $2,426 | $75,627 | $6,000 | $69,627 |
| 2021 | $2,403 | $75,627 | $6,000 | $69,627 |
| 2020 | $2,407 | $75,627 | $6,000 | $69,627 |
| 2019 | $2,407 | $75,627 | $6,000 | $69,627 |
| 2018 | $2,167 | $75,627 | $6,000 | $69,627 |
| 2017 | $2,167 | $75,627 | $6,000 | $69,627 |
| 2016 | $2,167 | $75,627 | $6,000 | $69,627 |
| 2015 | $1,998 | $69,627 | $6,000 | $63,627 |
| 2014 | $1,843 | $64,228 | $6,000 | $58,228 |
| 2013 | -- | $63,268 | $5,040 | $58,228 |
| 2012 | -- | $63,267 | $5,040 | $58,227 |
J
Seller's Agent in 2016
Jessica Owens
Re/Max Of Albany
Source: Albany Board of REALTORS®
MLS Number: 136721
APN: 00350-020-00A
Ask me questions while you tour the home.