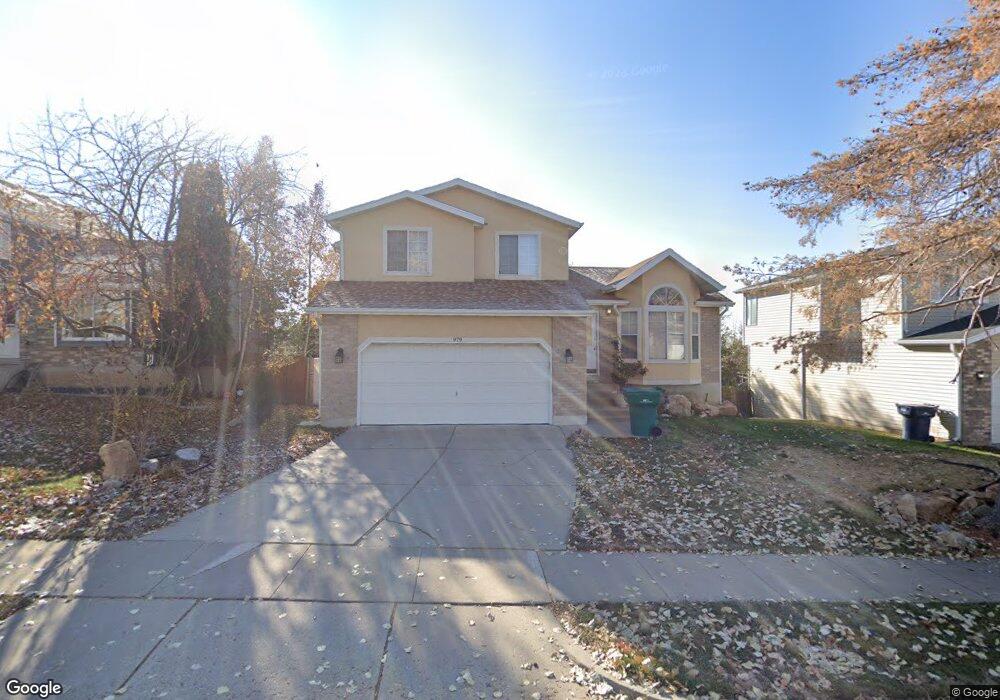
979 W 2600 N Layton, UT 84041
Estimated Value: $460,000 - $489,000
3
Beds
2
Baths
2,250
Sq Ft
$212/Sq Ft
Est. Value
About This Home
This home is located at 979 W 2600 N, Layton, UT 84041 and is currently estimated at $476,440, approximately $211 per square foot. 979 W 2600 N is a home located in Davis County with nearby schools including Lincoln Elementary School, North Layton Junior High School, and Northridge High School.
Ownership History
Date
Name
Owned For
Owner Type
Purchase Details
Closed on
Jan 10, 2023
Sold by
Rollins Yuko A
Bought by
Dane C And Yuko Anderson Revocable Living Tru
Current Estimated Value
Purchase Details
Closed on
Sep 18, 2009
Sold by
Rollins Derek S
Bought by
Rollins Yuko A
Home Financials for this Owner
Home Financials are based on the most recent Mortgage that was taken out on this home.
Original Mortgage
$67,000
Interest Rate
5.25%
Mortgage Type
New Conventional
Purchase Details
Closed on
Mar 20, 2000
Sold by
Morris Michael D
Bought by
Rollins Derek S and Rollins Yuko A
Home Financials for this Owner
Home Financials are based on the most recent Mortgage that was taken out on this home.
Original Mortgage
$119,000
Interest Rate
8.24%
Mortgage Type
FHA
Purchase Details
Closed on
Feb 9, 1998
Sold by
Ragsdale Thomas G and Ragsdale Virginia W
Bought by
Morris Michael D
Home Financials for this Owner
Home Financials are based on the most recent Mortgage that was taken out on this home.
Original Mortgage
$127,205
Interest Rate
6.95%
Create a Home Valuation Report for This Property
The Home Valuation Report is an in-depth analysis detailing your home's value as well as a comparison with similar homes in the area
Home Values in the Area
Average Home Value in this Area
Purchase History
| Date | Buyer | Sale Price | Title Company |
|---|---|---|---|
| Dane C And Yuko Anderson Revocable Living Tru | -- | -- | |
| Rollins Yuko A | -- | First American Title | |
| Rollins Derek S | -- | Founders Title Co | |
| Morris Michael D | -- | United Title Services |
Source: Public Records
Mortgage History
| Date | Status | Borrower | Loan Amount |
|---|---|---|---|
| Previous Owner | Rollins Yuko A | $67,000 | |
| Previous Owner | Rollins Derek S | $119,000 | |
| Previous Owner | Morris Michael D | $127,205 |
Source: Public Records
Tax History Compared to Growth
Tax History
| Year | Tax Paid | Tax Assessment Tax Assessment Total Assessment is a certain percentage of the fair market value that is determined by local assessors to be the total taxable value of land and additions on the property. | Land | Improvement |
|---|---|---|---|---|
| 2024 | $2,122 | $224,399 | $99,631 | $124,768 |
| 2023 | $2,135 | $398,000 | $127,651 | $270,349 |
| 2022 | $2,206 | $223,300 | $64,702 | $158,598 |
| 2021 | $1,915 | $289,000 | $83,812 | $205,188 |
| 2020 | $1,719 | $249,000 | $73,386 | $175,614 |
| 2019 | $1,720 | $244,000 | $72,413 | $171,587 |
| 2018 | $1,552 | $221,000 | $72,413 | $148,587 |
| 2016 | $1,387 | $101,860 | $21,250 | $80,610 |
| 2015 | $1,312 | $91,465 | $21,250 | $70,215 |
| 2014 | $1,313 | $93,604 | $21,250 | $72,354 |
| 2013 | -- | $89,229 | $20,680 | $68,549 |
Source: Public Records
Map
Nearby Homes
- 2402 N 725 W
- 2378 N 675 W
- 781 W 2150 N
- 2887 N 1175 W
- 2949 N 1175 W
- 2211 N 525 W
- 709 W Highway 193
- 2875 N Hill Field Rd Unit 58
- 2875 N Hill Field Rd Unit 17
- 2875 N Hill Field Rd Unit 62
- 850 S 1650 E Unit D
- 2187 N 450 W
- 1548 E 925 S
- 65 Sunset Dr
- 63 Sunset Dr
- 86 Atherton Way
- 121 Barrington Way
- 85 Atherton Way
- 2600 N Hill Field Rd Unit 4
- 2600 N Hill Field Rd Unit 138