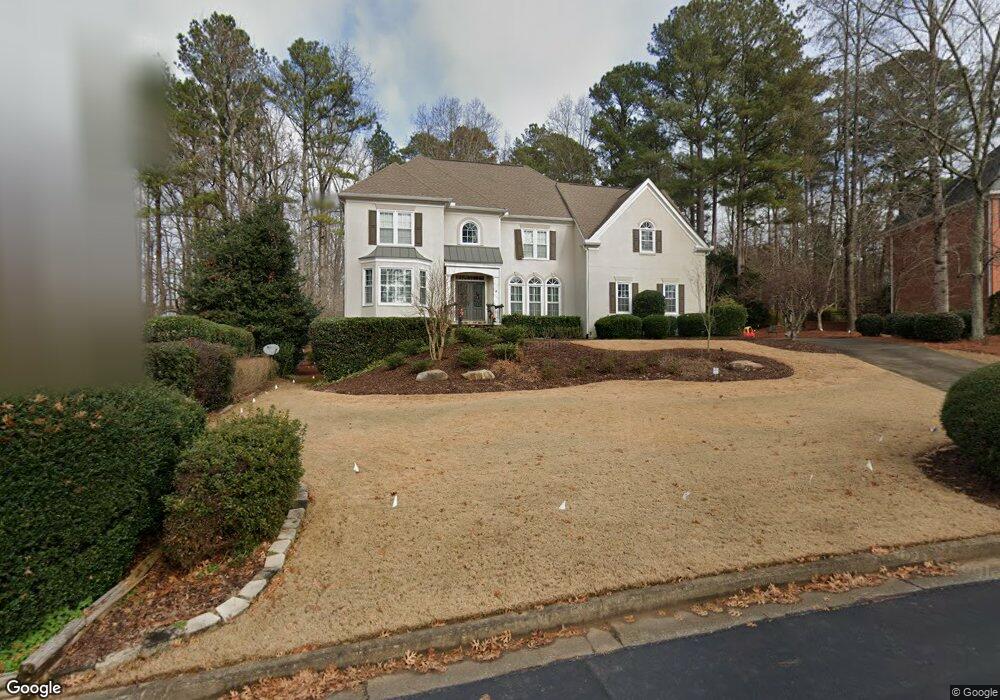
9790 Kennebec Way Alpharetta, GA 30022
Doublegate NeighborhoodEstimated Value: $895,000 - $970,000
5
Beds
5
Baths
2,983
Sq Ft
$310/Sq Ft
Est. Value
About This Home
This home is located at 9790 Kennebec Way, Alpharetta, GA 30022 and is currently estimated at $924,865, approximately $310 per square foot. 9790 Kennebec Way is a home located in Fulton County with nearby schools including State Bridge Crossing Elementary School, Autrey Mill Middle School, and Johns Creek High School.
Ownership History
Date
Name
Owned For
Owner Type
Purchase Details
Closed on
Jul 24, 2015
Sold by
Migliaccio Michael M
Bought by
Mcclain Bj and Mcclain Kara L
Current Estimated Value
Home Financials for this Owner
Home Financials are based on the most recent Mortgage that was taken out on this home.
Original Mortgage
$408,000
Outstanding Balance
$320,122
Interest Rate
4.04%
Mortgage Type
New Conventional
Estimated Equity
$604,743
Purchase Details
Closed on
Mar 24, 2014
Sold by
Migliaccio Michael
Bought by
Migliaccio Michael M and Migliaccio Family Revocable Tr
Purchase Details
Closed on
Dec 10, 2003
Sold by
Braning Sharron L
Bought by
Migliaccio Michael and Migliaccio Pamela
Home Financials for this Owner
Home Financials are based on the most recent Mortgage that was taken out on this home.
Original Mortgage
$308,000
Interest Rate
6.05%
Mortgage Type
New Conventional
Purchase Details
Closed on
Jul 6, 2000
Sold by
Braming Robert J
Bought by
Braming Sharron L
Create a Home Valuation Report for This Property
The Home Valuation Report is an in-depth analysis detailing your home's value as well as a comparison with similar homes in the area
Home Values in the Area
Average Home Value in this Area
Purchase History
| Date | Buyer | Sale Price | Title Company |
|---|---|---|---|
| Mcclain Bj | $510,000 | -- | |
| Migliaccio Michael M | -- | -- | |
| Migliaccio Michael | -- | -- | |
| Migliaccio Michael | $385,000 | -- | |
| Braming Sharron L | -- | -- |
Source: Public Records
Mortgage History
| Date | Status | Borrower | Loan Amount |
|---|---|---|---|
| Open | Mcclain Bj | $408,000 | |
| Previous Owner | Migliaccio Michael | $308,000 |
Source: Public Records
Tax History Compared to Growth
Tax History
| Year | Tax Paid | Tax Assessment Tax Assessment Total Assessment is a certain percentage of the fair market value that is determined by local assessors to be the total taxable value of land and additions on the property. | Land | Improvement |
|---|---|---|---|---|
| 2025 | $10,174 | $362,440 | $132,800 | $229,640 |
| 2023 | $7,219 | $255,760 | $58,320 | $197,440 |
| 2022 | $7,247 | $236,160 | $52,000 | $184,160 |
| 2021 | $6,707 | $212,880 | $54,360 | $158,520 |
| 2020 | $6,505 | $202,080 | $59,920 | $142,160 |
| 2019 | $722 | $183,200 | $54,040 | $129,160 |
| 2018 | $5,827 | $178,920 | $52,800 | $126,120 |
| 2017 | $6,090 | $178,920 | $52,800 | $126,120 |
| 2016 | $6,043 | $180,160 | $45,000 | $135,160 |
| 2015 | $5,689 | $180,160 | $45,000 | $135,160 |
| 2014 | $5,222 | $161,120 | $38,320 | $122,800 |
Source: Public Records
Map
Nearby Homes
- The Ellington Plan at Ward's Crossing
- The Jacobsen I Plan at Ward's Crossing
- The Jacobsen II Plan at Ward's Crossing
- The Benton III Plan at Ward's Crossing
- 608 Goldsmith Ct Unit 113
- 606 Goldsmith Ct Unit 114
- 602 Goldsmith Ct Unit 116
- 153 Wards Crossing Way Unit 8
- 153 Wards Crossing Way
- 149 Wards Crossing Way Unit 10
- 149 Wards Crossing Way
- 200 Wheatland Rd
- 1019 Crown Oak St Unit 51
- 1011 Crown Oak St Unit 47
- 504 Winston Croft Cir Unit 54
- 1017 Crown Oak St Unit 50
- 1007 Crown Oak St Unit 45
- 1003 Crown Oak St Unit 43
- 1005 Crown Oak St Unit 44
- 510 Winston Croft Cir Unit 56
- 9780 Kennebec Way Unit VI
- 9800 Kennebec Way
- 9810 Kennebec Way
- 9825 Kennebec Way
- 9815 Kennebec Way
- 9835 Kennebec Way
- 9855 Cameron Parc Cir
- 9845 Cameron Parc Cir
- 9865 Cameron Parc Cir
- 9835 Cameron Parc Cir
- 9865 Cameron Parc Cir
- 9820 Kennebec Way
- 9875 Cameron Parc Cir
- 9885 Cameron Parc Cir
- 9805 Kennebec Way
- 9825 9825 Cameron Parc
- 9825 Cameron Parc Cir
- 9815 Cameron Parc Cir
- 9845 Kennebec Way
- 5450 State Bridge Rd