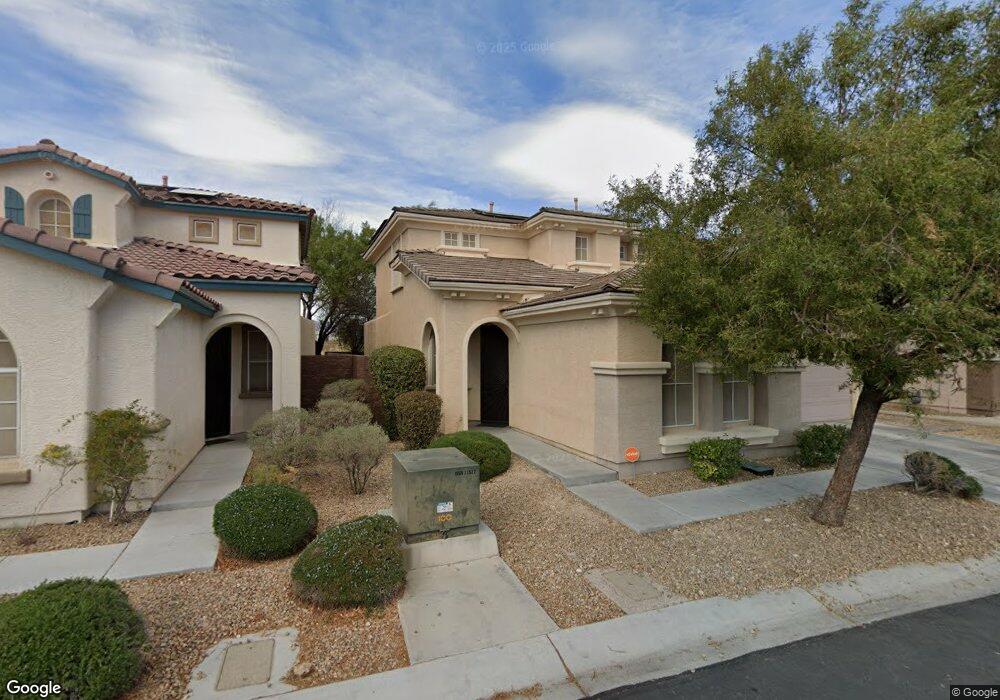
9793 Maspalomas St Las Vegas, NV 89178
Mountains Edge NeighborhoodEstimated Value: $449,000 - $473,000
4
Beds
4
Baths
1,905
Sq Ft
$241/Sq Ft
Est. Value
About This Home
This home is located at 9793 Maspalomas St, Las Vegas, NV 89178 and is currently estimated at $459,180, approximately $241 per square foot. 9793 Maspalomas St is a home located in Clark County with nearby schools including William V. Wright Elementary School, Desert Oasis High School, and Doral Academy Cactus.
Ownership History
Date
Name
Owned For
Owner Type
Purchase Details
Closed on
Jun 8, 2020
Sold by
Dixon Chadwick R
Bought by
Thompson Eddie
Current Estimated Value
Home Financials for this Owner
Home Financials are based on the most recent Mortgage that was taken out on this home.
Original Mortgage
$321,077
Outstanding Balance
$284,610
Interest Rate
3.2%
Mortgage Type
FHA
Estimated Equity
$174,570
Purchase Details
Closed on
Aug 5, 2011
Sold by
Hc Lv Funding Llc
Bought by
Dixon Chadwick R
Home Financials for this Owner
Home Financials are based on the most recent Mortgage that was taken out on this home.
Original Mortgage
$153,994
Interest Rate
4.75%
Mortgage Type
FHA
Purchase Details
Closed on
Apr 29, 2011
Sold by
Rusk David R and Rusk Deborah A
Bought by
Hc Lv Funding Llc
Purchase Details
Closed on
Sep 25, 2008
Sold by
Rusk David R and Rusk Deborah A
Bought by
9793 Maspalomas Llc
Purchase Details
Closed on
May 31, 2007
Sold by
Woodside Via Ventura Llc
Bought by
Rusk David R and Rusk Deborah A
Home Financials for this Owner
Home Financials are based on the most recent Mortgage that was taken out on this home.
Original Mortgage
$244,251
Interest Rate
7.25%
Mortgage Type
Unknown
Create a Home Valuation Report for This Property
The Home Valuation Report is an in-depth analysis detailing your home's value as well as a comparison with similar homes in the area
Home Values in the Area
Average Home Value in this Area
Purchase History
| Date | Buyer | Sale Price | Title Company |
|---|---|---|---|
| Thompson Eddie | $327,000 | Lawyers Title Las Vegas | |
| Dixon Chadwick R | $158,000 | Lawyers Title Of Nevada Hen | |
| Hc Lv Funding Llc | $119,000 | Lawyers Title Of Nevada Hen | |
| 9793 Maspalomas Llc | -- | None Available | |
| Rusk David R | $325,669 | Chicago Title |
Source: Public Records
Mortgage History
| Date | Status | Borrower | Loan Amount |
|---|---|---|---|
| Open | Thompson Eddie | $321,077 | |
| Previous Owner | Dixon Chadwick R | $153,994 | |
| Previous Owner | Rusk David R | $244,251 |
Source: Public Records
Tax History Compared to Growth
Tax History
| Year | Tax Paid | Tax Assessment Tax Assessment Total Assessment is a certain percentage of the fair market value that is determined by local assessors to be the total taxable value of land and additions on the property. | Land | Improvement |
|---|---|---|---|---|
| 2025 | $2,197 | $129,338 | $36,750 | $92,588 |
| 2024 | $1,848 | $129,338 | $36,750 | $92,588 |
| 2023 | $1,742 | $122,402 | $35,000 | $87,402 |
| 2022 | $1,794 | $107,624 | $28,000 | $79,624 |
| 2021 | $1,742 | $101,907 | $26,250 | $75,657 |
| 2020 | $1,688 | $101,989 | $27,300 | $74,689 |
| 2019 | $1,668 | $96,273 | $23,100 | $73,173 |
| 2018 | $1,591 | $89,174 | $18,900 | $70,274 |
| 2017 | $2,486 | $84,765 | $17,850 | $66,915 |
| 2016 | $1,742 | $70,639 | $14,000 | $56,639 |
| 2015 | $1,739 | $64,868 | $11,900 | $52,968 |
| 2014 | $1,692 | $47,646 | $7,000 | $40,646 |
Source: Public Records
Map
Nearby Homes
- 9864 Maspalomas St
- 8719 Mount Mira Loma Ave
- 8823 Autumn Teal Ave
- 8733 Autumn Teal Ave
- 8968 Horizon Hyatt Ave
- 9856 Chief Sky St
- 9031 Jumping Jacks Ave
- 8626 Anderson Dale Ave
- 8974 English Falls Way
- 9651 Bouncing Ball St
- 9076 Bridal Creek Ave
- 9091 Jumping Jacks Ave
- 9539 Iris Flat Ct
- 9659 Toy Soldier St
- 9806 Emerald Twilight St
- 8695 Canfield Canyon Ave
- 8547 Benidorm Ave
- 9141 Castle Valley Ave
- 9466 Marshall Creek St
- 9825 Emerald Twilight St
- 9785 Maspalomas St
- 9801 Maspalomas St
- 9809 Maspalomas St
- 9777 Maspalomas St
- 8819 Moreno Mountain Ave
- 8816 Moreno Mountain Ave
- 9817 Maspalomas St
- 9769 Maspalomas St
- 8811 Moreno Mountain Ave
- 8822 Livermore Valley Ave
- 8808 Moreno Mountain Ave
- 8817 Mount Mira Loma Ave
- 8814 Livermore Valley Ave Unit 2
- 8803 Moreno Mountain Ave
- 8809 Mount Mira Loma Ave
- 8809 Mount Mira Loma Ave Unit none
- 8800 Moreno Mountain Ave
- 8806 Livermore Valley Ave
- 9827 Maspalomas St
- 8795 Moreno Mountain Ave