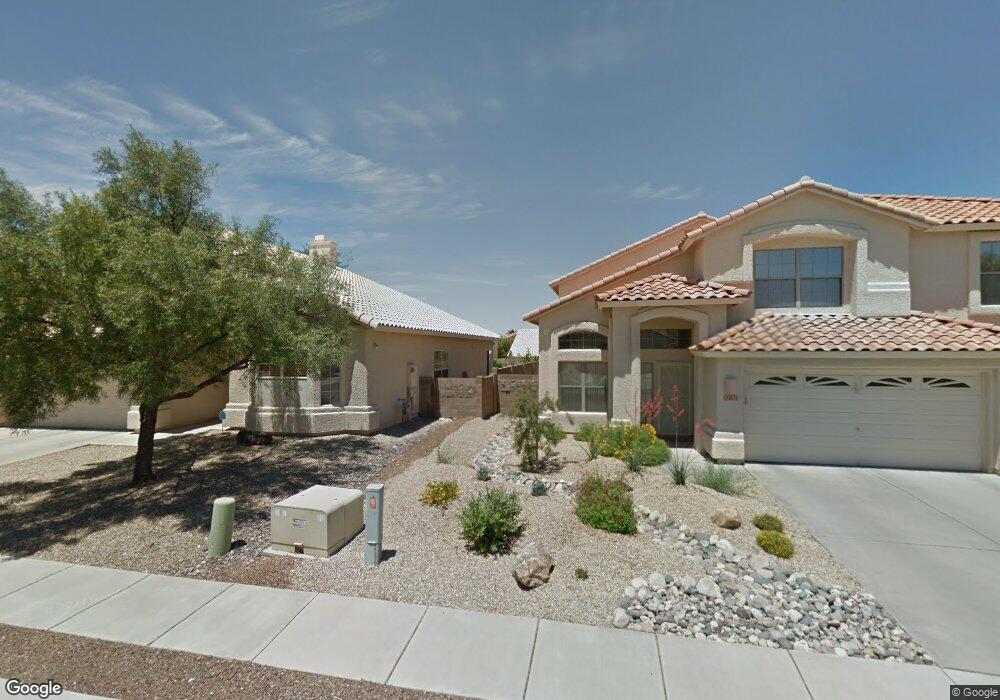
9797 E Pointe Pass Ct Tucson, AZ 85748
Eastside NeighborhoodEstimated Value: $380,000 - $475,000
Studio
3
Baths
2,372
Sq Ft
$182/Sq Ft
Est. Value
About This Home
This home is located at 9797 E Pointe Pass Ct, Tucson, AZ 85748 and is currently estimated at $430,744, approximately $181 per square foot. 9797 E Pointe Pass Ct is a home located in Pima County with nearby schools including Gale Elementary School, Gridley Middle School, and Sahuaro High School.
Ownership History
Date
Name
Owned For
Owner Type
Purchase Details
Closed on
Apr 15, 2024
Sold by
Abong Jose V and Abong Maria D
Bought by
Abong Family Revocable Trust
Current Estimated Value
Purchase Details
Closed on
Jan 7, 2021
Sold by
Abong Jose V and Abong Maria D
Bought by
Abong Jose V and Abong Maria D
Purchase Details
Closed on
May 12, 1998
Sold by
Abong Jose V and Abong Maria Dolores
Bought by
Abong Jose and Abong Maria Dolores
Purchase Details
Closed on
Dec 20, 1996
Sold by
Fidelity National Title Agency Inc
Bought by
Abong Jose and Abong Maria Dolores
Home Financials for this Owner
Home Financials are based on the most recent Mortgage that was taken out on this home.
Original Mortgage
$162,100
Interest Rate
7.67%
Mortgage Type
New Conventional
Create a Home Valuation Report for This Property
The Home Valuation Report is an in-depth analysis detailing your home's value as well as a comparison with similar homes in the area
Home Values in the Area
Average Home Value in this Area
Purchase History
| Date | Buyer | Sale Price | Title Company |
|---|---|---|---|
| Abong Family Revocable Trust | -- | None Listed On Document | |
| Abong Jose V | -- | None Listed On Document | |
| Abong Jose | -- | -- | |
| Abong Jose | $174,725 | -- |
Source: Public Records
Mortgage History
| Date | Status | Borrower | Loan Amount |
|---|---|---|---|
| Previous Owner | Abong Jose | $162,100 |
Source: Public Records
Tax History
| Year | Tax Paid | Tax Assessment Tax Assessment Total Assessment is a certain percentage of the fair market value that is determined by local assessors to be the total taxable value of land and additions on the property. | Land | Improvement |
|---|---|---|---|---|
| 2026 | $3,630 | $32,670 | -- | -- |
| 2025 | $3,630 | $31,115 | -- | -- |
| 2024 | $3,476 | $29,633 | -- | -- |
| 2023 | $3,258 | $28,222 | $0 | $0 |
| 2022 | $3,283 | $26,878 | $0 | $0 |
| 2021 | $3,294 | $24,379 | $0 | $0 |
| 2020 | $3,162 | $24,379 | $0 | $0 |
| 2019 | $3,071 | $23,671 | $0 | $0 |
| 2018 | $2,930 | $21,060 | $0 | $0 |
| 2017 | $2,796 | $21,060 | $0 | $0 |
| 2016 | $2,984 | $21,955 | $0 | $0 |
| 2015 | $2,900 | $21,248 | $0 | $0 |
Source: Public Records
Map
Nearby Homes
- 860 S Lucinda Dr
- 9774 E Holden Place
- 725 S Smokey Mountains Rd
- 750 S Sierra Nevada Dr
- 948 S Goldenweed Way
- 9896 E Wind Dancer Dr
- 790 S Ciudad Cir
- 690 S Chimney Canyon Dr
- 9657 E Briana Ln
- 1107 S Speckled Stone Way
- 9397 E Grapevine Spring Place
- 1137 S Speckled Stone Way
- 9410 E Grapevine Spring Place
- 220 S Vozack Ln
- 1420 S Corsica Place
- 9407 E Field Canyon Place
- 10205 E Kensington Dr
- 501 S Brown St
- 137 S Shadow Creek Place
- 661 S Granite Falls Dr
- 9789 E Pointe Pass Ct
- 9756 E Mcandrew Ct
- 9764 E Mcandrew Ct
- 9781 E Pointe Pass Ct
- 9748 E Mcandrew Ct
- 9772 E Mcandrew Ct
- 9792 E Pointe Pass Ct
- 9800 E Pointe Pass Ct
- 9784 E Pointe Pass Ct
- 9740 E Mcandrew Ct
- 9808 E Pointe Pass Ct
- 9773 E Pointe Pass Ct
- 9788 E Cisco Ct
- 9776 E Pointe Pass Ct Unit 34
- 9732 E Mcandrew Ct
- 9829 E Murchison Place
- 9796 E Cisco Ct
- 9824 E Murchison Place
- 9815 E Poncho Place
- 949 S Lucinda Dr
Your Personal Tour Guide
Ask me questions while you tour the home.