Estimated Value: $1,142,000 - $1,293,000
4
Beds
2
Baths
2,280
Sq Ft
$532/Sq Ft
Est. Value
About This Home
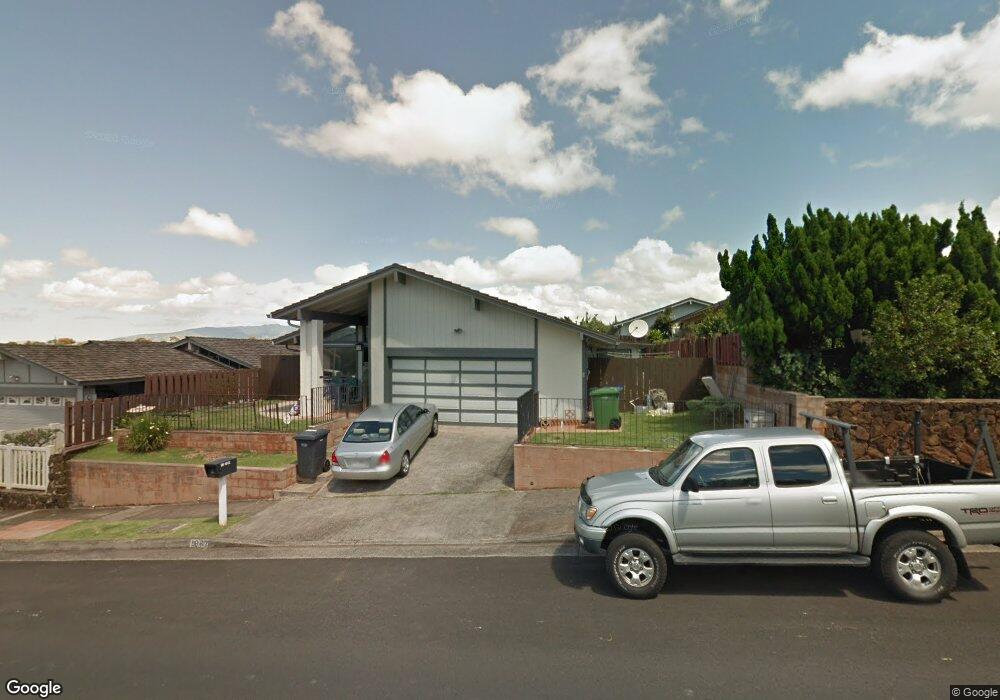
This home is located at 98-1612 Hapaki St, Aiea, HI 96701 and is currently estimated at $1,213,238, approximately $532 per square foot. 98-1612 Hapaki St is a home located in Honolulu County with nearby schools including Waimalu Elementary School, Aiea Intermediate School, and Aiea High School.
Ownership History
Date
Name
Owned For
Owner Type
Purchase Details
Closed on
May 15, 2022
Sold by
Wo Chong Kevin Tin and Wo Kimi Kelli
Bought by
Kevin Tin Wo Chong And Kelli Kimi Chong Revoc
Current Estimated Value
Purchase Details
Closed on
Feb 21, 2000
Sold by
Oyadomori Martha Hanako
Bought by
Chong Kevin Tin Wo and Chong Kelli Kimi
Home Financials for this Owner
Home Financials are based on the most recent Mortgage that was taken out on this home.
Original Mortgage
$280,000
Interest Rate
8.16%
Purchase Details
Closed on
Sep 10, 1999
Sold by
Oyadomori Martha Hanako and Yamaguchi Francine Hideko
Bought by
Oyadomori Martha H and Oyadomori Family Revocable Living Trust
Home Financials for this Owner
Home Financials are based on the most recent Mortgage that was taken out on this home.
Original Mortgage
$230,000
Interest Rate
10.5%
Create a Home Valuation Report for This Property
The Home Valuation Report is an in-depth analysis detailing your home's value as well as a comparison with similar homes in the area
Home Values in the Area
Average Home Value in this Area
Purchase History
| Date | Buyer | Sale Price | Title Company |
|---|---|---|---|
| Kevin Tin Wo Chong And Kelli Kimi Chong Revoc | -- | None Listed On Document | |
| Kevin Tin Wo Chong And Kelli Kimi Chong Revoc | -- | None Listed On Document | |
| Chong Kevin Tin Wo | $350,000 | -- | |
| Oyadomori Martha H | -- | Fidelity National Title Ins | |
| Oyadomori Martha Hanako | -- | Fidelity National Title Ins |
Source: Public Records
Mortgage History
| Date | Status | Borrower | Loan Amount |
|---|---|---|---|
| Previous Owner | Chong Kevin Tin Wo | $280,000 | |
| Previous Owner | Oyadomori Martha Hanako | $230,000 |
Source: Public Records
Tax History Compared to Growth
Tax History
| Year | Tax Paid | Tax Assessment Tax Assessment Total Assessment is a certain percentage of the fair market value that is determined by local assessors to be the total taxable value of land and additions on the property. | Land | Improvement |
|---|---|---|---|---|
| 2025 | $3,812 | $1,189,600 | $997,500 | $192,100 |
| 2024 | $3,812 | $1,209,000 | $997,500 | $211,500 |
| 2023 | $3,952 | $1,229,100 | $997,500 | $231,600 |
| 2022 | $3,463 | $1,089,400 | $866,300 | $223,100 |
| 2021 | $2,788 | $896,700 | $693,000 | $203,700 |
| 2020 | $3,049 | $971,000 | $750,800 | $220,200 |
| 2019 | $2,834 | $921,500 | $682,500 | $239,000 |
| 2018 | $2,834 | $889,700 | $630,000 | $259,700 |
| 2017 | $2,697 | $850,700 | $630,000 | $220,700 |
| 2016 | $2,721 | $857,300 | $577,500 | $279,800 |
| 2015 | $2,435 | $775,700 | $550,000 | $225,700 |
| 2014 | -- | $769,200 | $495,000 | $274,200 |
Source: Public Records
Map
Nearby Homes
- 98-524 Lulu Place Unit 84
- 98-519 Lulu Place Unit 73
- 98-1743 Ulu St
- 98-1941-J Kaahumanu St Unit 61
- 98-635 Leke Place
- 98-1772 Piku Way
- 98-448 Kilinoe St Unit 9907
- 98-1794 Kupukupu St
- 98-1658 Hoomaike St
- 98-628 Kuini St Unit 1801
- 98-1739 Kaahumanu St Unit 35C
- 98-432 Ponohana Loop Unit 10G
- 98-718-D Kaonohi St Unit 38
- 98-833 Noelani St Unit 155
- 98-1461 Kamahao St Unit 3
- 98-1409 Kamahao St Unit 158
- 98-621 Kilinoe St Unit 4B1
- 98-525 Kamahao Place Unit 27
- 98-1796 Kaahumanu St Unit 61D
- 98-673 Kilinoe St
- 98-1620 Hapaki St
- 98-1608 Hapaki St
- 98-1625 Apala Loop
- 98-1629 Apala Loop
- 98-1606 Hapaki St
- 98-1626 Hapaki St
- 98-1604 Piki St
- 98-1621 Apala Loop
- 98-1635 Apala Loop
- 98-1617 Apala Loop
- 98-1625 Hapaki St
- 98-1628 Hapaki St
- 98-1602 Hapaki St
- 98-1608 Piki St
- 98-1637 Apala Loop
- 98-1605 Piki St
- 98-1627 Hapaki St
- 98-1615 Apala Loop
- 98-1624 Apala Loop
- 98-1628 Apala Loop