Estimated Value: $756,000 - $978,000
3
Beds
3
Baths
1,292
Sq Ft
$645/Sq Ft
Est. Value
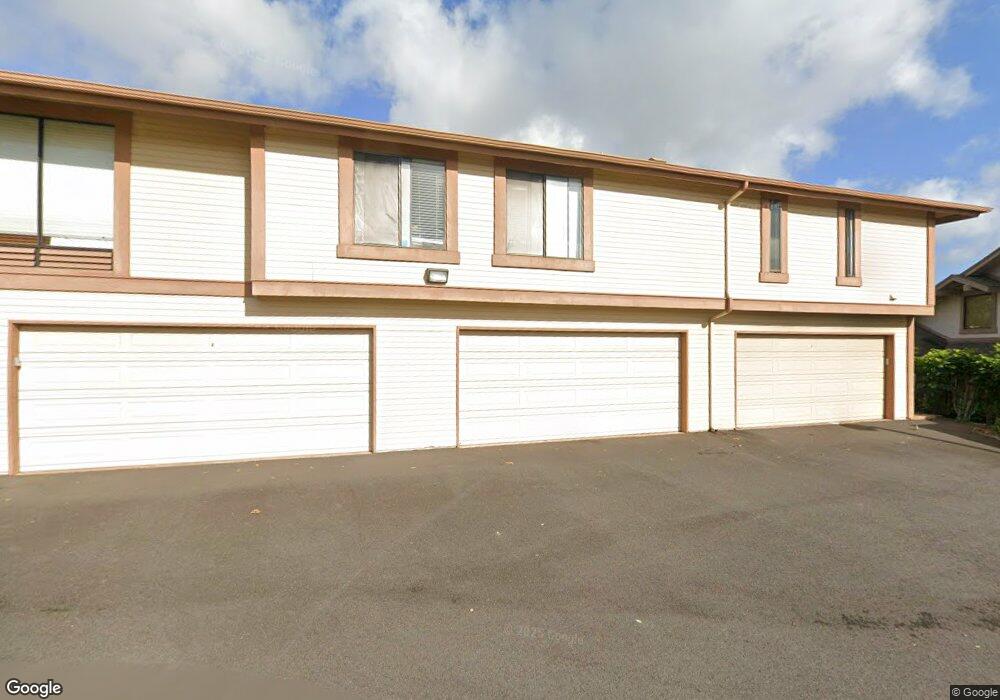
About This Home
This home is located at 98-1821 Kaahumanu St Unit 79C, Aiea, HI 96701 and is currently estimated at $832,820, approximately $644 per square foot. 98-1821 Kaahumanu St Unit 79C is a home located in Honolulu County with nearby schools including Waimalu Elementary School, Aiea Intermediate School, and Aiea High School.
Ownership History
Date
Name
Owned For
Owner Type
Purchase Details
Closed on
Aug 26, 2024
Sold by
Revocable Trust Of Raymond L Jablonski and Pascua Christine
Bought by
Kazunaga Sherry
Current Estimated Value
Home Financials for this Owner
Home Financials are based on the most recent Mortgage that was taken out on this home.
Original Mortgage
$560,000
Outstanding Balance
$554,055
Interest Rate
6.77%
Mortgage Type
New Conventional
Estimated Equity
$278,765
Purchase Details
Closed on
Nov 23, 2005
Sold by
Plotts Diane Joyce and Kihune Robert Kalani Uichi
Bought by
Jablonski Raymond L and Revocable Trust Of Raymond L Jablonski
Home Financials for this Owner
Home Financials are based on the most recent Mortgage that was taken out on this home.
Original Mortgage
$120,000
Interest Rate
6.07%
Mortgage Type
Fannie Mae Freddie Mac
Create a Home Valuation Report for This Property
The Home Valuation Report is an in-depth analysis detailing your home's value as well as a comparison with similar homes in the area
Home Values in the Area
Average Home Value in this Area
Purchase History
| Date | Buyer | Sale Price | Title Company |
|---|---|---|---|
| Kazunaga Sherry | -- | Fam | |
| Jablonski Raymond L | $89,400 | Tg |
Source: Public Records
Mortgage History
| Date | Status | Borrower | Loan Amount |
|---|---|---|---|
| Open | Kazunaga Sherry | $560,000 | |
| Previous Owner | Jablonski Raymond L | $120,000 |
Source: Public Records
Tax History Compared to Growth
Tax History
| Year | Tax Paid | Tax Assessment Tax Assessment Total Assessment is a certain percentage of the fair market value that is determined by local assessors to be the total taxable value of land and additions on the property. | Land | Improvement |
|---|---|---|---|---|
| 2025 | $2,109 | $768,700 | $591,800 | $176,900 |
| 2024 | $2,109 | $762,600 | $560,700 | $201,900 |
| 2023 | $1,960 | $800,000 | $560,700 | $239,300 |
| 2022 | $1,879 | $676,800 | $513,900 | $162,900 |
| 2021 | $1,727 | $633,400 | $498,400 | $135,000 |
| 2020 | $1,716 | $630,400 | $498,400 | $132,000 |
| 2019 | $1,854 | $649,800 | $567,100 | $82,700 |
| 2018 | $1,803 | $635,000 | $486,100 | $148,900 |
| 2017 | $1,564 | $566,800 | $397,000 | $169,800 |
| 2016 | $1,498 | $548,100 | $364,600 | $183,500 |
| 2015 | $1,470 | $539,900 | $356,500 | $183,400 |
| 2014 | $1,269 | $497,800 | $340,300 | $157,500 |
Source: Public Records
Map
Nearby Homes
- 98-1819 Kaahumanu St Unit 78B
- 98-1747 Kaahumanu St Unit 39B
- 98-1784 Kaahumanu St Unit 66C
- 98-1758 Kaahumanu St Unit 52C
- 98-1739 Kaahumanu St Unit 35C
- 98-1911 Kaahumanu St Unit 94
- 98-1848 Mikinolia Place
- 98-1794 Kupukupu St
- 98-1772 Piku Way
- 98-442 Hoono St
- 98-1475 Kaahumanu St Unit A150
- 683 Hoomoana St
- 98-628 Kuini St Unit 1801
- 98-524 Lulu Place Unit 84
- 286 Hoomalu St
- 98-718-D Kaonohi St Unit 38
- 98-459 Hookanike St Unit 65
- 98-833 Noelani St Unit 155
- 98-1461 Kamahao St Unit 3
- 98-1415 Kamahao St Unit 14113
- 98-1821 Kaahumanu St Unit 79A
- 98-1821 Kaahumanu St Unit D
- 98-1821 Kaahumanu St Unit B
- 98-1821 Kaahumanu St Unit 79B
- 98-1821 Kaahumanu St Unit 79C
- 98-1819 Kaahumanu St Unit D
- 98-1819 Kaahumanu St Unit 78A
- 98-1819 Kaahumanu St Unit 78C
- 98-1819 Kaahumanu St Unit A
- 98-1819 Kaahumanu St Unit C
- 98-1823 Kaahumanu St Unit 80A
- 98-1823 Kaahumanu St Unit 80B
- 98-1823 Kaahumanu St Unit 80C
- 98-1823 Kaahumanu St Unit D
- 98-1807 Kaahumanu St Unit D
- 98-1807 Kaahumanu St Unit 77A
- 98-1807 Kaahumanu St Unit 77C
- 98-1807 Kaahumanu St Unit 77A
- 98-1807 Kaahumanu St Unit B
- 98-1807 Kaahumanu St Unit A