Estimated Value: $1,935,000 - $2,198,000
7
Beds
5
Baths
2,830
Sq Ft
$740/Sq Ft
Est. Value
About This Home
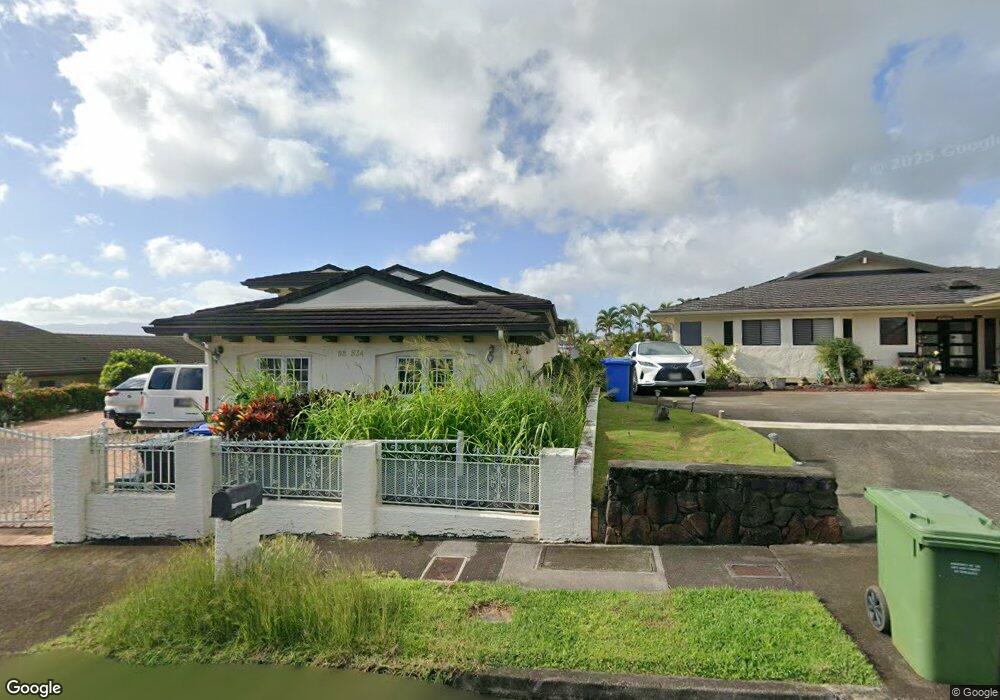
This home is located at 98-834 Ainanui Loop, Aiea, HI 96701 and is currently estimated at $2,094,853, approximately $740 per square foot. 98-834 Ainanui Loop is a home located in Honolulu County with nearby schools including Pearl Ridge Elementary School, Aiea Intermediate School, and Aiea High School.
Ownership History
Date
Name
Owned For
Owner Type
Purchase Details
Closed on
Feb 24, 2020
Sold by
Butay Luis Manglalan and Butay Belen Ganac
Bought by
Butay Luis M and Butay Belen G
Current Estimated Value
Purchase Details
Closed on
Jun 14, 1996
Sold by
Manglalan Butay Jr Luis and Ganac Butay Belen
Bought by
Manglalan Butay Jr Luis and Ganac Butay Belen
Home Financials for this Owner
Home Financials are based on the most recent Mortgage that was taken out on this home.
Original Mortgage
$540,000
Outstanding Balance
$35,287
Interest Rate
8.25%
Estimated Equity
$2,059,566
Purchase Details
Closed on
Jan 10, 1996
Sold by
Gendrano Brigido Angulo and Gendrano Melga Torre
Bought by
Butay Luis Manglal Lan and Butay Helen Ganac
Purchase Details
Closed on
Jun 17, 1993
Sold by
Manglalan Butay Jr Luis and Ganac Butay Belen
Bought by
Manglalan Butay Jr Luis and Ganac Butay Belen
Create a Home Valuation Report for This Property
The Home Valuation Report is an in-depth analysis detailing your home's value as well as a comparison with similar homes in the area
Home Values in the Area
Average Home Value in this Area
Purchase History
| Date | Buyer | Sale Price | Title Company |
|---|---|---|---|
| Butay Luis M | -- | None Available | |
| Butay Luis M | -- | None Available | |
| Butay Luis M | -- | None Available | |
| Manglalan Butay Jr Luis | -- | -- | |
| Butay Luis Manglal Lan | $1,000 | -- | |
| Manglalan Butay Jr Luis | -- | -- |
Source: Public Records
Mortgage History
| Date | Status | Borrower | Loan Amount |
|---|---|---|---|
| Open | Manglalan Butay Jr Luis | $540,000 |
Source: Public Records
Tax History Compared to Growth
Tax History
| Year | Tax Paid | Tax Assessment Tax Assessment Total Assessment is a certain percentage of the fair market value that is determined by local assessors to be the total taxable value of land and additions on the property. | Land | Improvement |
|---|---|---|---|---|
| 2025 | $6,397 | $2,051,100 | $1,241,800 | $809,300 |
| 2024 | $6,397 | $1,987,700 | $1,241,800 | $745,900 |
| 2023 | $3,467 | $2,105,200 | $1,241,800 | $863,400 |
| 2022 | $5,948 | $1,839,300 | $962,000 | $877,300 |
| 2021 | $5,243 | $1,638,100 | $944,500 | $693,600 |
| 2020 | $5,205 | $1,627,200 | $892,000 | $735,200 |
| 2019 | $5,272 | $1,626,200 | $874,500 | $751,700 |
| 2018 | $5,111 | $1,580,200 | $874,500 | $705,700 |
| 2017 | $2,718 | $1,599,000 | $874,500 | $724,500 |
| 2016 | $4,918 | $1,525,100 | $699,900 | $825,200 |
| 2015 | $4,447 | $1,390,700 | $699,900 | $690,800 |
| 2014 | -- | $1,338,800 | $620,400 | $718,400 |
Source: Public Records
Map
Nearby Homes
- 98-812 Kahaea Place
- 98-1794 Kupukupu St
- 98-1848 Mikinolia Place
- 98-2026 Hapaki St
- 98-635 Leke Place
- 98-628 Kuini St Unit 1801
- 98-718-D Kaonohi St Unit 38
- 98-1743 Ulu St
- 98-1911 Kaahumanu St Unit 94
- 98-621 Kilinoe St Unit 4B1
- 98-685 Kaonohi St Unit F
- 98-809 Kaonohi St Unit C
- 98-1819 Kaahumanu St Unit 78B
- 98-500 Kaonohi St Unit 473
- 98-1747 Kaahumanu St Unit 39B
- 98-1739 Kaahumanu St Unit 35C
- 98-915 Kaonohi St Unit 100
- 98-1796 Kaahumanu St Unit 61D
- 98-408 Kilinoe St Unit 1101
- 98-405 Kaonohi St Unit 242
- 98-832 Ainanui Loop
- 98-836 Ainanui Loop
- 98-838 Ainanui Loop
- 98-828 Ainanui Loop
- 98-835 Ainanui Loop
- 98-831 Ainanui Loop
- 98-826 Ainanui Loop
- 98-842 Ainanui Loop
- 98-827 Ainanui Loop
- 98 Lanikuakaa St
- 98-841 Ainanui Loop
- 98-822 Ainanui Loop
- 98-844 Ainanui Loop
- 98-831 Kahaea Place
- 98-821 Ainanui Loop
- 98-838 Lanikuakaa St
- 98-845 Ainanui Loop
- 98-848 Ainanui Loop
- 98-827 Kahaea Place
- 98-820 Ainanui Loop