Estimated Value: $1,787,000 - $1,924,746
3
Beds
4
Baths
2,590
Sq Ft
$717/Sq Ft
Est. Value
About This Home
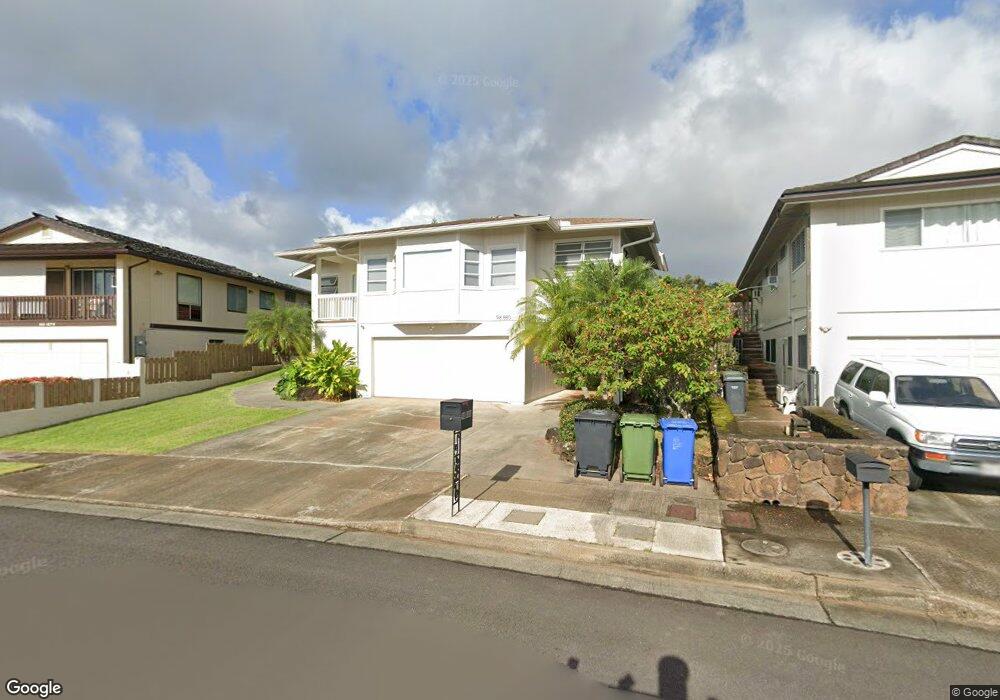
This home is located at 98-880 Ainanui Loop, Aiea, HI 96701 and is currently estimated at $1,855,937, approximately $716 per square foot. 98-880 Ainanui Loop is a home located in Honolulu County with nearby schools including Pearl Ridge Elementary School, Aiea Intermediate School, and Aiea High School.
Ownership History
Date
Name
Owned For
Owner Type
Purchase Details
Closed on
Jul 10, 2023
Sold by
Chang Toby Koichi
Bought by
Chang Toby Koichi and Lui-Kwan Taylor Anela
Current Estimated Value
Purchase Details
Closed on
Sep 21, 2021
Sold by
Mary S Hinazumi Revocable Living Trust and Ashley Chang Jr Wilfred
Bought by
Chang Toby
Home Financials for this Owner
Home Financials are based on the most recent Mortgage that was taken out on this home.
Original Mortgage
$620,000
Interest Rate
2.8%
Mortgage Type
VA
Purchase Details
Closed on
Jun 29, 2021
Sold by
Hinazumi May Sachi Uyehara
Bought by
May S Hinazumi Revocable Living Trust and Hinazumi
Purchase Details
Closed on
Dec 10, 2020
Sold by
Hinazumi May Sachi Uyehara
Bought by
Hinazumi May Sachi Uyehara and Chang Wilfred Ashley
Home Financials for this Owner
Home Financials are based on the most recent Mortgage that was taken out on this home.
Original Mortgage
$620,000
Interest Rate
2.7%
Mortgage Type
New Conventional
Create a Home Valuation Report for This Property
The Home Valuation Report is an in-depth analysis detailing your home's value as well as a comparison with similar homes in the area
Home Values in the Area
Average Home Value in this Area
Purchase History
| Date | Buyer | Sale Price | Title Company |
|---|---|---|---|
| Chang Toby Koichi | -- | Accommodation/Courtesy Recordi | |
| Chang Toby | -- | Title Guaranty & Escrow Servic | |
| May S Hinazumi Revocable Living Trust | -- | None Listed On Document | |
| Hinazumi May S | -- | None Available | |
| Hinazumi May Sachi Uyehara | $1,000 | Fam | |
| Hinazumi May Sachi Uyehar | -- | First American Title Of Hawaii | |
| Hinazumi May Sachi Uyehara | $1,000 | Fam |
Source: Public Records
Mortgage History
| Date | Status | Borrower | Loan Amount |
|---|---|---|---|
| Previous Owner | Chang Toby | $620,000 | |
| Previous Owner | Hinazumi May Sachi Uyehara | $620,000 |
Source: Public Records
Tax History
| Year | Tax Paid | Tax Assessment Tax Assessment Total Assessment is a certain percentage of the fair market value that is determined by local assessors to be the total taxable value of land and additions on the property. | Land | Improvement |
|---|---|---|---|---|
| 2025 | $5,362 | $1,715,300 | $1,079,000 | $636,300 |
| 2024 | $5,362 | $1,652,100 | $1,079,000 | $573,100 |
| 2023 | $4,858 | $1,588,100 | $1,079,000 | $509,100 |
| 2022 | $4,363 | $1,346,600 | $835,800 | $510,800 |
| 2021 | $4,146 | $1,324,700 | $820,600 | $504,100 |
| 2020 | $3,812 | $1,229,100 | $775,000 | $454,100 |
| 2019 | $4,122 | $1,271,500 | $759,800 | $511,700 |
| 2018 | $4,122 | $1,297,800 | $759,800 | $538,000 |
| 2017 | $3,883 | $1,229,500 | $759,800 | $469,700 |
| 2016 | $3,929 | $1,242,600 | $643,700 | $598,900 |
| 2015 | $3,600 | $1,148,600 | $643,700 | $504,900 |
| 2014 | -- | $1,092,600 | $570,500 | $522,100 |
Source: Public Records
Map
Nearby Homes
- 98-2033 Pahiolo St
- 98-879-B Kaonohi St Unit 67
- 98-628 Kuini St Unit 1801
- 98-673 Kilinoe St
- 98-889 Kaonohi St Unit A76
- 98-715 Kaonohi St Unit 26
- 98-582 Kilinoe St Unit 98
- 98-607 Kilinoe St Unit 8E1
- 98-607 Kilinoe St Unit 8B2
- 98-930 Iho Place Unit 128
- 98-1655 Piki St
- 98-1605 Piki St
- 98-719 Iho Place Unit 51105
- 98-719 Iho Place Unit 51404
- 98-707 Iho Place Unit 2903
- 98-707 Iho Place Unit 21001
- 98-1819 Kaahumanu St Unit 78B
- 98-715 Iho Place Unit 4303
- 98-715 Iho Place Unit 4105
- 98-715 Iho Place Unit 4301
- 98-878 Ainanui Loop
- 98-882 Ainanui Loop
- 98-874 Ainanui Loop
- 98-886 Ainanui Loop Unit 1214
- 98-868 Naukewai Place Unit 1504
- 98-881 Ainanui Loop
- 98-877 Ainanui Loop
- 98-872 Ainanui Loop
- 98-890 Ainanui Loop
- 98-885 Ainanui Loop
- 98-873 Ainanui Loop
- 98-867 Naukewai Place
- 98-868 Ainanui Loop
- 98-889 Ainanui Loop
- 98-869 Ainanui Loop
- 98-892 Ainanui Loop
- 98-893 Ainanui Loop
- 98-864 Ainanui Loop
- 98-864 Naukewai Place
- 98-865 Ainanui Loop
Your Personal Tour Guide
Ask me questions while you tour the home.