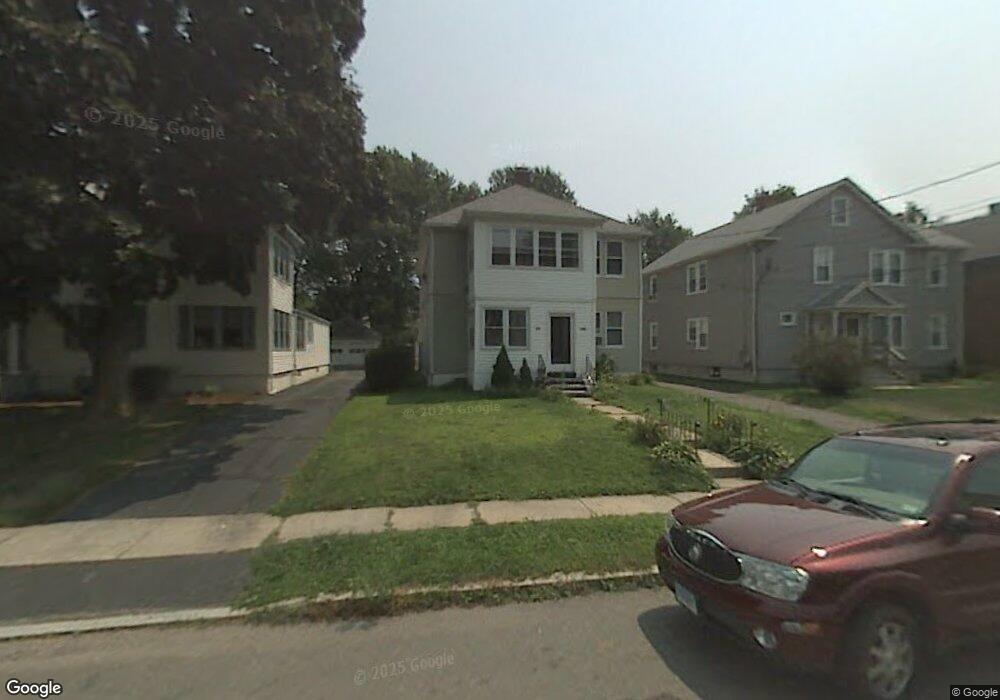
98 Cambridge St West Hartford, CT 06110
Estimated Value: $420,057 - $516,000
5
Beds
2
Baths
2,196
Sq Ft
$219/Sq Ft
Est. Value
About This Home
This home is located at 98 Cambridge St, West Hartford, CT 06110 and is currently estimated at $481,764, approximately $219 per square foot. 98 Cambridge St is a home located in Hartford County with nearby schools including Webster Hill School, Sedgwick Middle School, and Conard High School.
Ownership History
Date
Name
Owned For
Owner Type
Purchase Details
Closed on
Dec 7, 2020
Sold by
Downey Robert M
Bought by
Downey Merly L
Current Estimated Value
Purchase Details
Closed on
Jun 8, 2015
Sold by
Downey Merly L and Delcastillo Nerida
Bought by
Downey 3Rd Robert M and Downey Merly L
Purchase Details
Closed on
Aug 11, 2008
Sold by
Franco Enterprises Llc
Bought by
Del-Castillo Merly and Del-Castillo Nerida
Home Financials for this Owner
Home Financials are based on the most recent Mortgage that was taken out on this home.
Original Mortgage
$282,765
Interest Rate
6.49%
Purchase Details
Closed on
Jul 28, 1995
Sold by
Jpace Gabriel and Martin Susan
Bought by
Martinez Marcia
Home Financials for this Owner
Home Financials are based on the most recent Mortgage that was taken out on this home.
Original Mortgage
$116,550
Interest Rate
7.56%
Mortgage Type
Unknown
Create a Home Valuation Report for This Property
The Home Valuation Report is an in-depth analysis detailing your home's value as well as a comparison with similar homes in the area
Home Values in the Area
Average Home Value in this Area
Purchase History
| Date | Buyer | Sale Price | Title Company |
|---|---|---|---|
| Downey Merly L | -- | None Available | |
| Downey 3Rd Robert M | -- | -- | |
| Del-Castillo Merly | $285,000 | -- | |
| Martinez Marcia | $117,500 | -- |
Source: Public Records
Mortgage History
| Date | Status | Borrower | Loan Amount |
|---|---|---|---|
| Previous Owner | Martinez Marcia | $282,765 | |
| Previous Owner | Martinez Marcia | $218,500 | |
| Previous Owner | Martinez Marcia | $116,550 |
Source: Public Records
Tax History Compared to Growth
Tax History
| Year | Tax Paid | Tax Assessment Tax Assessment Total Assessment is a certain percentage of the fair market value that is determined by local assessors to be the total taxable value of land and additions on the property. | Land | Improvement |
|---|---|---|---|---|
| 2025 | $10,043 | $224,280 | $56,210 | $168,070 |
| 2024 | $9,498 | $224,280 | $56,210 | $168,070 |
| 2023 | $9,249 | $226,030 | $56,210 | $169,820 |
| 2022 | $9,195 | $226,030 | $56,210 | $169,820 |
| 2021 | $9,074 | $213,920 | $54,040 | $159,880 |
| 2020 | $8,117 | $194,180 | $45,500 | $148,680 |
| 2019 | $8,117 | $194,180 | $45,500 | $148,680 |
| 2018 | $7,961 | $194,180 | $45,500 | $148,680 |
| 2017 | $7,969 | $194,180 | $45,500 | $148,680 |
| 2016 | $7,301 | $184,800 | $52,850 | $131,950 |
| 2015 | $7,080 | $184,800 | $52,850 | $131,950 |
| 2014 | $6,906 | $184,800 | $52,850 | $131,950 |
Source: Public Records
Map
Nearby Homes
- 121 Cambridge St
- 108 Newington Rd
- 148 Colonial St
- 49 Somerset St
- 1145 New Britain Ave
- 61 Colonial St
- 107 Westgate St
- 90 Park Place Cir Unit 90
- 49 Park Place Cir Unit 49
- 39 Cortland St
- 18 Federal St
- 204 Trout Brook Dr
- 29 Sunnyside Rd
- 479 S Main St
- 17 Parkview Rd
- 422 S Main St
- 90 Meriline Ave
- 741 Quaker Ln S
- 161 Abbotsford Ave
- 93 Stanwood St
- 94 Cambridge St
- 102 Cambridge St
- 90 Cambridge St
- 106 Cambridge St
- 86 Cambridge St
- 110 Cambridge St
- 97 Woodlawn St
- 101 Woodlawn St
- 93 Woodlawn St
- 82 Cambridge St
- 116 Cambridge St
- 105 Woodlawn St
- 101 Cambridge St
- 89 Woodlawn St
- 97 Cambridge St
- 93 Cambridge St
- 109 Woodlawn St
- 105 Cambridge St
- 85 Woodlawn St
- 89 Cambridge St