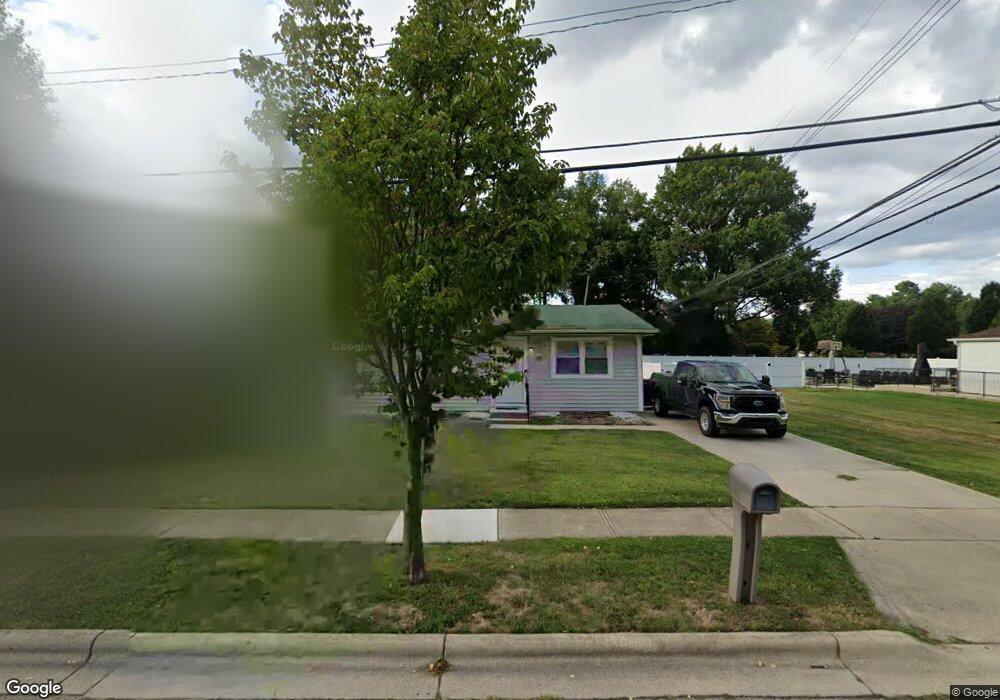
98 Cherry St Groveport, OH 43125
Estimated Value: $192,839 - $207,000
3
Beds
1
Bath
1,026
Sq Ft
$195/Sq Ft
Est. Value
About This Home
This home is located at 98 Cherry St, Groveport, OH 43125 and is currently estimated at $199,960, approximately $194 per square foot. 98 Cherry St is a home located in Franklin County with nearby schools including Groveport Madison High School, Groveport Community School, and Madison Christian School.
Ownership History
Date
Name
Owned For
Owner Type
Purchase Details
Closed on
Aug 17, 2006
Sold by
Bepler Gary L and Bepler Jean S
Bought by
Bepler Gary L and Gary L Bepler Trust
Current Estimated Value
Purchase Details
Closed on
Jun 8, 2004
Sold by
Billips Terry L and Billips Pauline L
Bought by
Bepler Todd Luann and Belper Gary
Home Financials for this Owner
Home Financials are based on the most recent Mortgage that was taken out on this home.
Original Mortgage
$80,000
Interest Rate
6.06%
Mortgage Type
Purchase Money Mortgage
Purchase Details
Closed on
Oct 13, 1972
Bought by
Billips Terry L
Create a Home Valuation Report for This Property
The Home Valuation Report is an in-depth analysis detailing your home's value as well as a comparison with similar homes in the area
Home Values in the Area
Average Home Value in this Area
Purchase History
| Date | Buyer | Sale Price | Title Company |
|---|---|---|---|
| Bepler Gary L | -- | None Available | |
| Bepler Todd Luann | $85,000 | -- | |
| Billips Terry L | -- | -- |
Source: Public Records
Mortgage History
| Date | Status | Borrower | Loan Amount |
|---|---|---|---|
| Closed | Bepler Todd Luann | $80,000 |
Source: Public Records
Tax History Compared to Growth
Tax History
| Year | Tax Paid | Tax Assessment Tax Assessment Total Assessment is a certain percentage of the fair market value that is determined by local assessors to be the total taxable value of land and additions on the property. | Land | Improvement |
|---|---|---|---|---|
| 2024 | $2,406 | $48,100 | $20,130 | $27,970 |
| 2023 | $2,385 | $48,090 | $20,125 | $27,965 |
| 2022 | $1,890 | $30,420 | $8,230 | $22,190 |
| 2021 | $1,897 | $30,420 | $8,230 | $22,190 |
| 2020 | $1,902 | $30,420 | $8,230 | $22,190 |
| 2019 | $1,813 | $25,550 | $6,860 | $18,690 |
| 2018 | $1,781 | $25,550 | $6,860 | $18,690 |
| 2017 | $1,775 | $25,550 | $6,860 | $18,690 |
| 2016 | $1,723 | $21,880 | $6,690 | $15,190 |
| 2015 | $1,738 | $21,880 | $6,690 | $15,190 |
| 2014 | $1,639 | $21,880 | $6,690 | $15,190 |
| 2013 | $738 | $23,030 | $7,035 | $15,995 |
Source: Public Records
Map
Nearby Homes