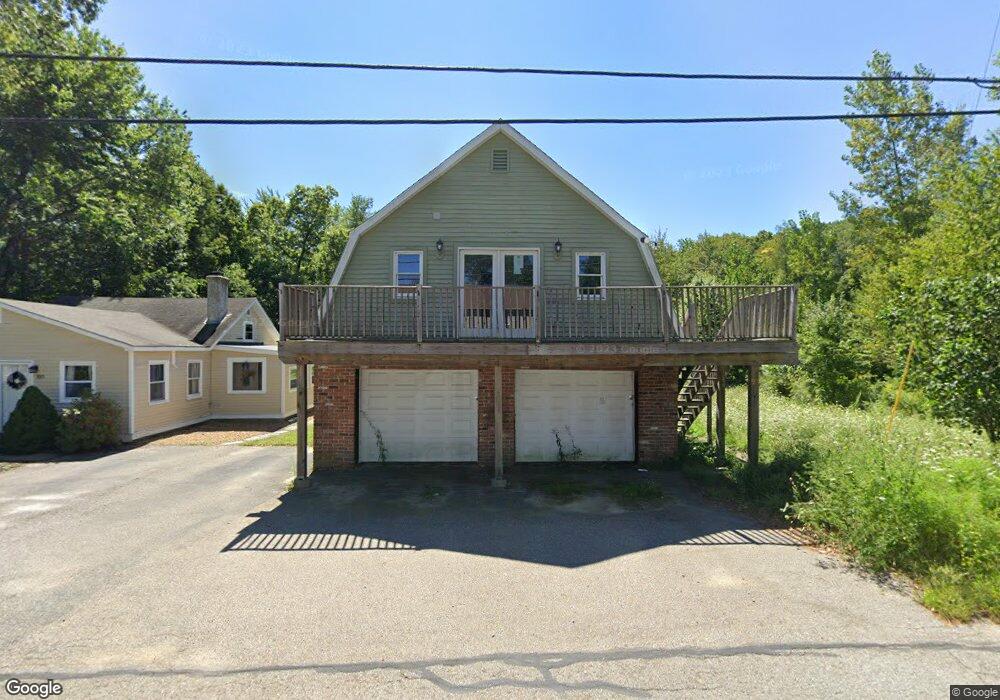
98 Clark Rd Spencer, MA 01562
Estimated Value: $284,000 - $413,000
2
Beds
2
Baths
1,378
Sq Ft
$261/Sq Ft
Est. Value
About This Home
This home is located at 98 Clark Rd, Spencer, MA 01562 and is currently estimated at $359,440, approximately $260 per square foot. 98 Clark Rd is a home located in Worcester County with nearby schools including David Prouty High School.
Ownership History
Date
Name
Owned For
Owner Type
Purchase Details
Closed on
Jul 26, 2011
Sold by
Bay Path Re Llc
Bought by
Zink Manuel
Current Estimated Value
Home Financials for this Owner
Home Financials are based on the most recent Mortgage that was taken out on this home.
Original Mortgage
$147,172
Outstanding Balance
$101,567
Interest Rate
4.5%
Mortgage Type
FHA
Estimated Equity
$257,873
Purchase Details
Closed on
Aug 27, 2010
Sold by
Canavan Elaine M
Bought by
Bay Path Re Llc
Create a Home Valuation Report for This Property
The Home Valuation Report is an in-depth analysis detailing your home's value as well as a comparison with similar homes in the area
Home Values in the Area
Average Home Value in this Area
Purchase History
| Date | Buyer | Sale Price | Title Company |
|---|---|---|---|
| Zink Manuel | $151,000 | -- | |
| Bay Path Re Llc | $15,000 | -- |
Source: Public Records
Mortgage History
| Date | Status | Borrower | Loan Amount |
|---|---|---|---|
| Open | Zink Manuel | $147,172 |
Source: Public Records
Tax History
| Year | Tax Paid | Tax Assessment Tax Assessment Total Assessment is a certain percentage of the fair market value that is determined by local assessors to be the total taxable value of land and additions on the property. | Land | Improvement |
|---|---|---|---|---|
| 2025 | $30 | $256,500 | $41,300 | $215,200 |
| 2024 | $2,810 | $245,600 | $41,300 | $204,300 |
| 2023 | $2,665 | $221,000 | $41,300 | $179,700 |
| 2022 | $2,575 | $195,700 | $37,500 | $158,200 |
| 2021 | $2,552 | $181,800 | $37,500 | $144,300 |
| 2020 | $2,609 | $184,800 | $37,500 | $147,300 |
| 2019 | $2,455 | $177,100 | $33,900 | $143,200 |
| 2018 | $2,190 | $163,200 | $39,400 | $123,800 |
| 2017 | $2,150 | $153,800 | $37,500 | $116,300 |
| 2016 | $2,052 | $143,600 | $37,500 | $106,100 |
| 2015 | $2,027 | $148,300 | $44,900 | $103,400 |
| 2014 | $1,950 | $148,300 | $44,900 | $103,400 |
Source: Public Records
Map
Nearby Homes
- 94 Clark Rd
- 25 Clark Rd
- Lot 2 Gould Rd
- Lot 1 Gould Rd
- Lot 3 Gould Rd
- Lot 9 Gould Rd
- Lot 4 Gould Rd
- Lot 5 Gould Rd
- 94 E Charlton Rd
- 8 Sunset Dr
- 10 Park Ln
- 50 Old Spencer Rd
- 10 Edward St
- 75 Huntoon Memorial Hwy Unit 1-2
- 1 Cole Dr Unit 1
- 0 I Capen Rd
- 7 Hycrest Rd
- 8 Hycrest Rd
- 404 Rawson St
- 4 N Meadow Ln
Your Personal Tour Guide
Ask me questions while you tour the home.