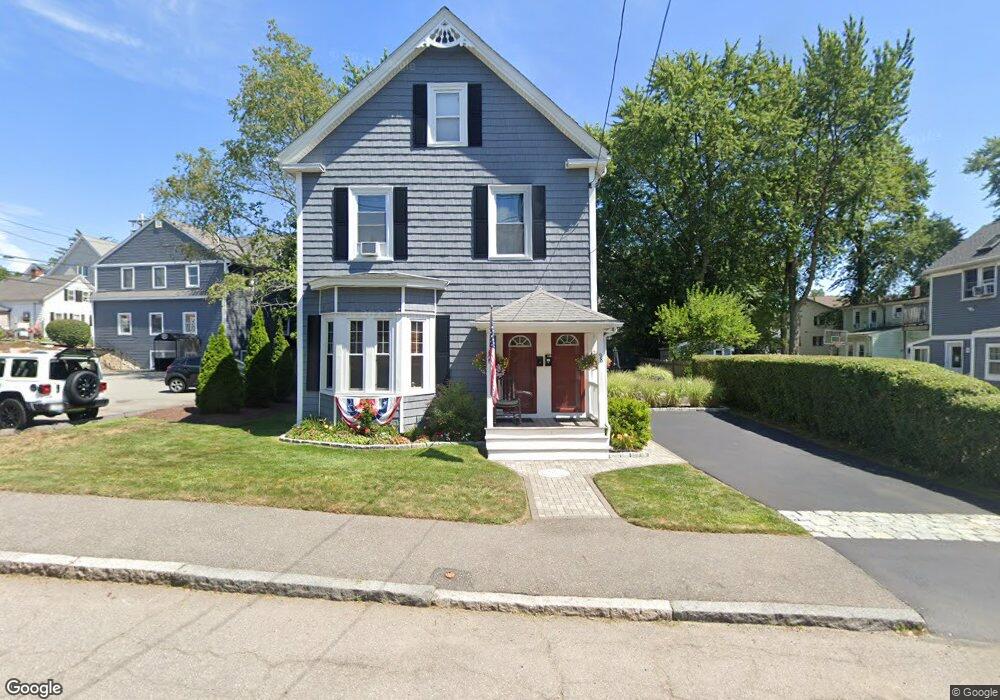
98 Cross St Quincy, MA 02169
South Quincy NeighborhoodEstimated Value: $716,000 - $782,000
3
Beds
2
Baths
1,548
Sq Ft
$483/Sq Ft
Est. Value
About This Home
This home is located at 98 Cross St, Quincy, MA 02169 and is currently estimated at $747,706, approximately $483 per square foot. 98 Cross St is a home located in Norfolk County with nearby schools including South West Middle School, Lincoln-Hancock Community School, and Quincy High School.
Ownership History
Date
Name
Owned For
Owner Type
Purchase Details
Closed on
Mar 31, 1995
Sold by
Peters Charles M
Bought by
Cronin Michael J
Current Estimated Value
Home Financials for this Owner
Home Financials are based on the most recent Mortgage that was taken out on this home.
Original Mortgage
$85,500
Interest Rate
8.8%
Mortgage Type
Purchase Money Mortgage
Create a Home Valuation Report for This Property
The Home Valuation Report is an in-depth analysis detailing your home's value as well as a comparison with similar homes in the area
Home Values in the Area
Average Home Value in this Area
Purchase History
| Date | Buyer | Sale Price | Title Company |
|---|---|---|---|
| Cronin Michael J | $95,000 | -- |
Source: Public Records
Mortgage History
| Date | Status | Borrower | Loan Amount |
|---|---|---|---|
| Open | Cronin Michael J | $86,000 | |
| Closed | Cronin Michael J | $85,500 |
Source: Public Records
Tax History Compared to Growth
Tax History
| Year | Tax Paid | Tax Assessment Tax Assessment Total Assessment is a certain percentage of the fair market value that is determined by local assessors to be the total taxable value of land and additions on the property. | Land | Improvement |
|---|---|---|---|---|
| 2025 | $7,640 | $662,600 | $312,700 | $349,900 |
| 2024 | $7,181 | $637,200 | $297,900 | $339,300 |
| 2023 | $6,816 | $612,400 | $283,800 | $328,600 |
| 2022 | $6,256 | $522,200 | $227,100 | $295,100 |
| 2021 | $6,363 | $524,100 | $227,100 | $297,000 |
| 2020 | $6,336 | $509,700 | $227,100 | $282,600 |
| 2019 | $5,865 | $467,300 | $220,600 | $246,700 |
| 2018 | $5,544 | $415,600 | $204,300 | $211,300 |
| 2017 | $5,590 | $394,500 | $194,600 | $199,900 |
| 2016 | $5,142 | $358,100 | $177,000 | $181,100 |
| 2015 | $4,944 | $338,600 | $167,000 | $171,600 |
| 2014 | $4,506 | $303,200 | $167,000 | $136,200 |
Source: Public Records
Map
Nearby Homes
- 211 Copeland St
- 42 West St
- 510 Willard St
- 57 Buckley St
- 46-48 Buckley St
- 46 Suomi Rd
- 46 Suomi Rd Unit 46
- 1 Cityview Ln Unit 506
- 1 Cityview Ln Unit 709
- 14 Arthur Ave
- 211 West St Unit 12B
- 12 Arthur Ave
- 73 Connell St
- 52 Bunker Hill Ln
- 21 Arthur St
- 25 Carrolls Ln
- 91 Garfield St
- 29 Oconnell Ave
- 10 White St
- 63 Adele Rd
- 100 Cross St
- 252 Copeland St Unit 3
- 252 Copeland St Unit 1
- 252 Copeland St Unit T4
- 252 Copeland St Unit 2
- 252 Copeland St Unit T1-2
- 252 Copeland St Unit T3
- 252 Copeland St
- 104 Cross St
- 102 Cross St
- 248 Copeland St
- 108 Cross St
- 110 Cross St
- 75 Miller St
- 253 Copeland St Unit A
- 253 Copeland St
- 247 Copeland St
- 107 Cross St
- 251 Copeland St
- 251 Copeland St Unit C