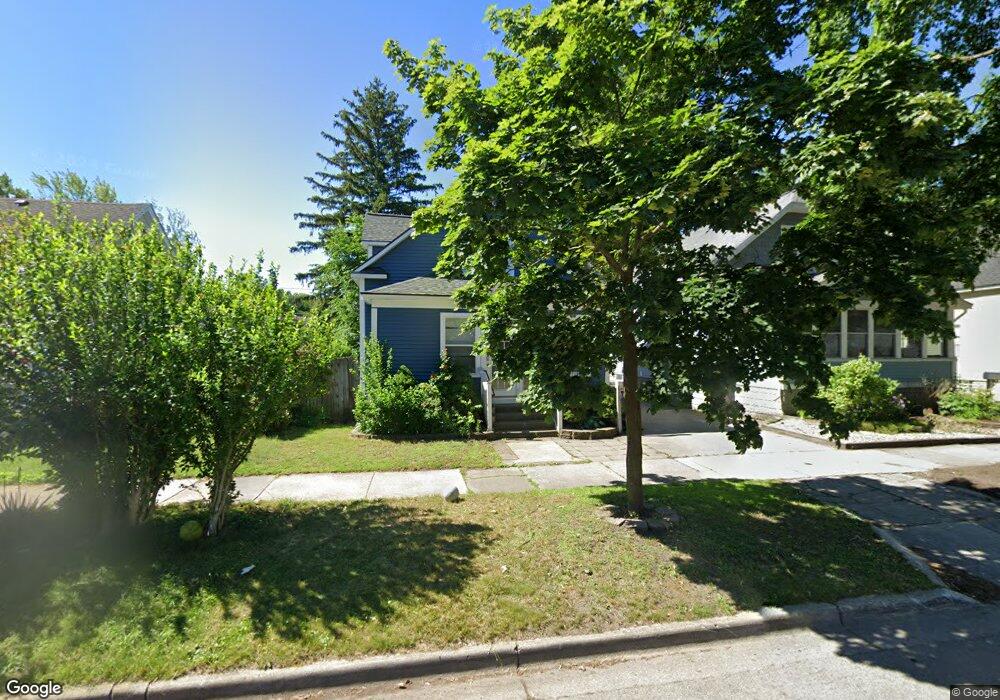
98 E 18th St Holland, MI 49423
Rosa Parks Green NeighborhoodEstimated Value: $258,000 - $286,000
3
Beds
1
Bath
1,224
Sq Ft
$221/Sq Ft
Est. Value
About This Home
This home is located at 98 E 18th St, Holland, MI 49423 and is currently estimated at $270,565, approximately $221 per square foot. 98 E 18th St is a home located in Ottawa County with nearby schools including Maplewood, Holland Middle School, and Holland High School.
Ownership History
Date
Name
Owned For
Owner Type
Purchase Details
Closed on
Apr 17, 2006
Sold by
Hud
Bought by
Vidals Deisy
Current Estimated Value
Home Financials for this Owner
Home Financials are based on the most recent Mortgage that was taken out on this home.
Original Mortgage
$40,000
Outstanding Balance
$23,146
Interest Rate
6.48%
Mortgage Type
New Conventional
Estimated Equity
$247,420
Purchase Details
Closed on
Dec 20, 2005
Sold by
Mortgage Electronic Registration Systems
Bought by
Hud
Purchase Details
Closed on
Nov 17, 2005
Sold by
Harmer Anthony D and Morello Paula L
Bought by
Mortgage Electronic Registration Systems
Purchase Details
Closed on
Jun 25, 1997
Sold by
Reyes Jesus Correa
Bought by
Harmer Anthony D
Purchase Details
Closed on
Feb 9, 1996
Sold by
Smith Michael C
Bought by
Reyes Jesus Correa
Purchase Details
Closed on
Feb 1, 1995
Sold by
Perry Albert J
Bought by
Smith Michael C
Create a Home Valuation Report for This Property
The Home Valuation Report is an in-depth analysis detailing your home's value as well as a comparison with similar homes in the area
Home Values in the Area
Average Home Value in this Area
Purchase History
We collect this data history from publicly available records. To have your information removed, we recommend requesting removal directly through your county’s website.
| Date | Buyer | Sale Price | Title Company |
|---|---|---|---|
| Vidals Deisy | -- | Lighthouse Title | |
| Hud | -- | None Available | |
| Mortgage Electronic Registration Systems | $66,243 | -- | |
| Harmer Anthony D | $66,000 | -- | |
| Reyes Jesus Correa | $53,800 | -- | |
| Smith Michael C | $49,900 | -- |
Source: Public Records
Mortgage History
We collect this data history from publicly available records. To have your information removed, we recommend requesting removal directly through your county’s website.
| Date | Status | Borrower | Loan Amount |
|---|---|---|---|
| Open | Vidals Deisy | $40,000 |
Source: Public Records
Tax History
| Year | Tax Paid | Tax Assessment Tax Assessment Total Assessment is a certain percentage of the fair market value that is determined by local assessors to be the total taxable value of land and additions on the property. | Land | Improvement |
|---|---|---|---|---|
| 2025 | $2,144 | $110,400 | $0 | $0 |
| 2024 | $21 | $101,200 | $0 | $0 |
| 2023 | $1,295 | $81,400 | $0 | $0 |
| 2022 | $1,295 | $71,000 | $0 | $0 |
| 2021 | $1,259 | $65,300 | $0 | $0 |
| 2020 | $1,257 | $52,800 | $0 | $0 |
| 2019 | $1,267 | $44,600 | $0 | $0 |
| 2018 | $1,193 | $39,400 | $0 | $0 |
| 2017 | $1,156 | $39,400 | $0 | $0 |
| 2016 | $1,156 | $36,700 | $0 | $0 |
| 2015 | $1,120 | $33,000 | $0 | $0 |
| 2014 | $1,120 | $28,900 | $0 | $0 |
Source: Public Records
Map
Nearby Homes
- 127 E 15th St
- 40 W 18th St
- 322 College Ave
- 533 Columbia Ave Unit 6
- 533 Columbia Ave Unit 107
- 533 Columbia Ave Unit 7
- 533 Columbia Ave Unit 22
- 231 E 16th St
- 14 E 24th St
- 175 E 25th St
- 588 Central Ave
- 141 E 26th St
- 193 E 26th St
- 314 Foxcroft Cir Unit 19
- 309 Glen Garry Ct
- 202 E 26th St
- 44 W 26th St
- 17 W 10th St Unit 220
- 17 W 10th St Unit 450
- 349 Maple Ave
Your Personal Tour Guide
Ask me questions while you tour the home.