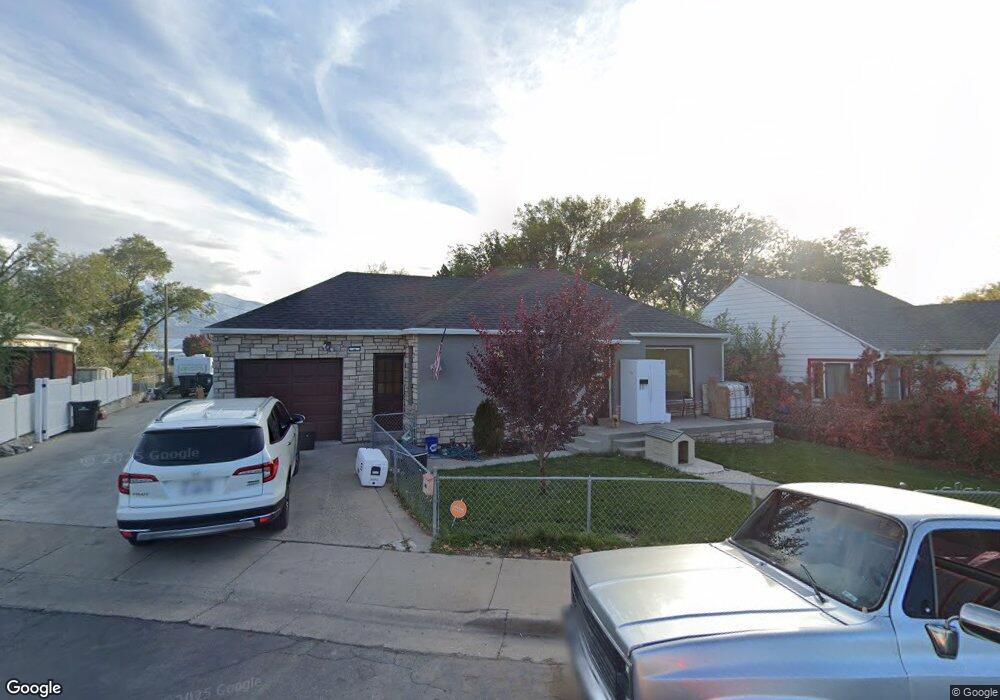
98 E 400 S Spanish Fork, UT 84660
Estimated Value: $476,000 - $544,000
4
Beds
3
Baths
3,096
Sq Ft
$168/Sq Ft
Est. Value
About This Home
This home is located at 98 E 400 S, Spanish Fork, UT 84660 and is currently estimated at $520,957, approximately $168 per square foot. 98 E 400 S is a home located in Utah County with nearby schools including Canyon Elementary School, Spanish Fork Jr High School, and Spanish Fork High School.
Ownership History
Date
Name
Owned For
Owner Type
Purchase Details
Closed on
May 27, 2020
Sold by
Behling Matthew C
Bought by
Martinez Jaime Oropeza
Current Estimated Value
Purchase Details
Closed on
Jul 9, 2018
Sold by
Huff Gloria Evans and The Shyrl Ney Huff Gloria Evan
Bought by
Behling Matthew C
Home Financials for this Owner
Home Financials are based on the most recent Mortgage that was taken out on this home.
Original Mortgage
$268,055
Interest Rate
4.75%
Mortgage Type
FHA
Purchase Details
Closed on
Mar 18, 2008
Sold by
Huff Shyrl N and Huff Gloria E
Bought by
Huff Shyrl Ney and Huff Gloria Evans
Create a Home Valuation Report for This Property
The Home Valuation Report is an in-depth analysis detailing your home's value as well as a comparison with similar homes in the area
Home Values in the Area
Average Home Value in this Area
Purchase History
| Date | Buyer | Sale Price | Title Company |
|---|---|---|---|
| Martinez Jaime Oropeza | -- | Gt Title Svcs Spanish Park | |
| Behling Matthew C | -- | First American Title | |
| Huff Shyrl Ney | -- | None Available |
Source: Public Records
Mortgage History
| Date | Status | Borrower | Loan Amount |
|---|---|---|---|
| Previous Owner | Behling Matthew C | $268,055 |
Source: Public Records
Tax History
| Year | Tax Paid | Tax Assessment Tax Assessment Total Assessment is a certain percentage of the fair market value that is determined by local assessors to be the total taxable value of land and additions on the property. | Land | Improvement |
|---|---|---|---|---|
| 2025 | $2,314 | $267,355 | -- | -- |
| 2024 | $2,314 | $238,535 | $0 | $0 |
| 2023 | $2,291 | $236,445 | $0 | $0 |
| 2022 | $2,273 | $230,065 | $0 | $0 |
| 2021 | $2,018 | $326,800 | $83,300 | $243,500 |
| 2020 | $1,835 | $288,800 | $69,400 | $219,400 |
| 2019 | $1,648 | $272,900 | $69,400 | $203,500 |
| 2018 | $1,560 | $249,800 | $69,400 | $180,400 |
| 2017 | $1,397 | $120,230 | $0 | $0 |
| 2016 | $0 | $99,110 | $0 | $0 |
| 2015 | -- | $88,715 | $0 | $0 |
| 2014 | -- | $81,070 | $0 | $0 |
Source: Public Records
Map
Nearby Homes
- 390 S 300 E
- 298 S St Unit 205
- 296 S St Unit 20
- 324 S St Unit 204
- 844 S 200 E Unit 4-304
- 844 S 200 E Unit 4 -201
- 243 S 300 E
- 134 W 700 S
- 721 S 110 W
- 733 S 170 W
- 837 S 200 E Unit 5-303
- 837 S 200 E Unit 5-201
- 837 S 200 E Unit 5-301
- 691 S 260 W
- 216 E 850 S Unit 6-204
- 216 E 850 S Unit 6-201
- 216 E 850 S Unit 6-101
- 272 E 850 S Unit 7-204
- 272 E 850 S Unit 7-203
- 272 E 850 S Unit 7-201
Your Personal Tour Guide
Ask me questions while you tour the home.