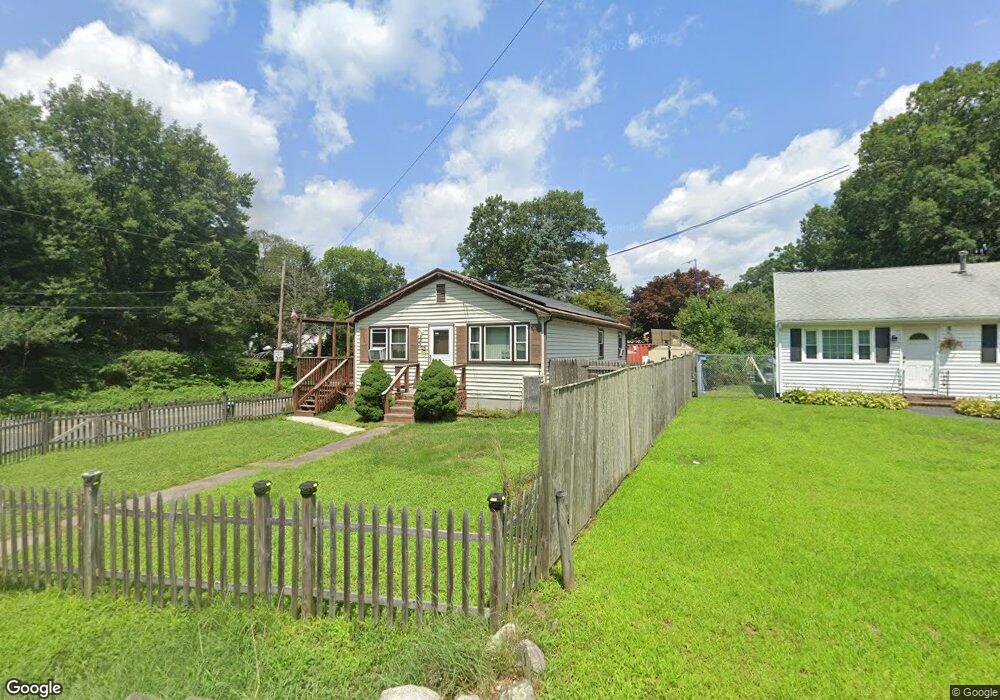
98 East St Brockton, MA 02302
Estimated Value: $445,000 - $485,000
3
Beds
1
Bath
1,008
Sq Ft
$470/Sq Ft
Est. Value
About This Home
This home is located at 98 East St, Brockton, MA 02302 and is currently estimated at $473,402, approximately $469 per square foot. 98 East St is a home located in Plymouth County with nearby schools including Brookfield Elementary School, Downey Elementary School, and Mary E. Baker Elementary School.
Ownership History
Date
Name
Owned For
Owner Type
Purchase Details
Closed on
Jul 29, 2005
Sold by
Donahue James G and Comeau Margaret E
Bought by
Vonleh Lincoln Z and Vonleh Sarah D
Current Estimated Value
Home Financials for this Owner
Home Financials are based on the most recent Mortgage that was taken out on this home.
Original Mortgage
$253,298
Outstanding Balance
$133,146
Interest Rate
5.67%
Mortgage Type
Purchase Money Mortgage
Estimated Equity
$340,256
Purchase Details
Closed on
Mar 15, 2000
Sold by
Weiner Ronald S
Bought by
Comeau Joseph A and Graham Margaret
Purchase Details
Closed on
May 18, 1998
Sold by
Murphy Richard L and Murphy Alzira M
Bought by
Weiner Ronald S
Create a Home Valuation Report for This Property
The Home Valuation Report is an in-depth analysis detailing your home's value as well as a comparison with similar homes in the area
Home Values in the Area
Average Home Value in this Area
Purchase History
| Date | Buyer | Sale Price | Title Company |
|---|---|---|---|
| Vonleh Lincoln Z | $260,000 | -- | |
| Comeau Joseph A | $115,000 | -- | |
| Weiner Ronald S | $104,000 | -- |
Source: Public Records
Mortgage History
| Date | Status | Borrower | Loan Amount |
|---|---|---|---|
| Open | Weiner Ronald S | $253,298 | |
| Previous Owner | Weiner Ronald S | $197,600 |
Source: Public Records
Tax History Compared to Growth
Tax History
| Year | Tax Paid | Tax Assessment Tax Assessment Total Assessment is a certain percentage of the fair market value that is determined by local assessors to be the total taxable value of land and additions on the property. | Land | Improvement |
|---|---|---|---|---|
| 2025 | $4,922 | $406,400 | $156,500 | $249,900 |
| 2024 | $4,820 | $401,000 | $156,500 | $244,500 |
| 2023 | $4,522 | $348,400 | $106,600 | $241,800 |
| 2022 | $4,438 | $317,700 | $96,900 | $220,800 |
| 2021 | $4,195 | $289,300 | $88,800 | $200,500 |
| 2020 | $4,234 | $279,500 | $78,400 | $201,100 |
| 2019 | $4,172 | $268,500 | $74,400 | $194,100 |
| 2018 | $3,552 | $221,200 | $74,400 | $146,800 |
| 2017 | $3,376 | $209,700 | $74,400 | $135,300 |
| 2016 | $3,397 | $195,700 | $70,900 | $124,800 |
| 2015 | $3,091 | $170,300 | $70,900 | $99,400 |
| 2014 | $3,031 | $167,200 | $70,900 | $96,300 |
Source: Public Records
Map
Nearby Homes