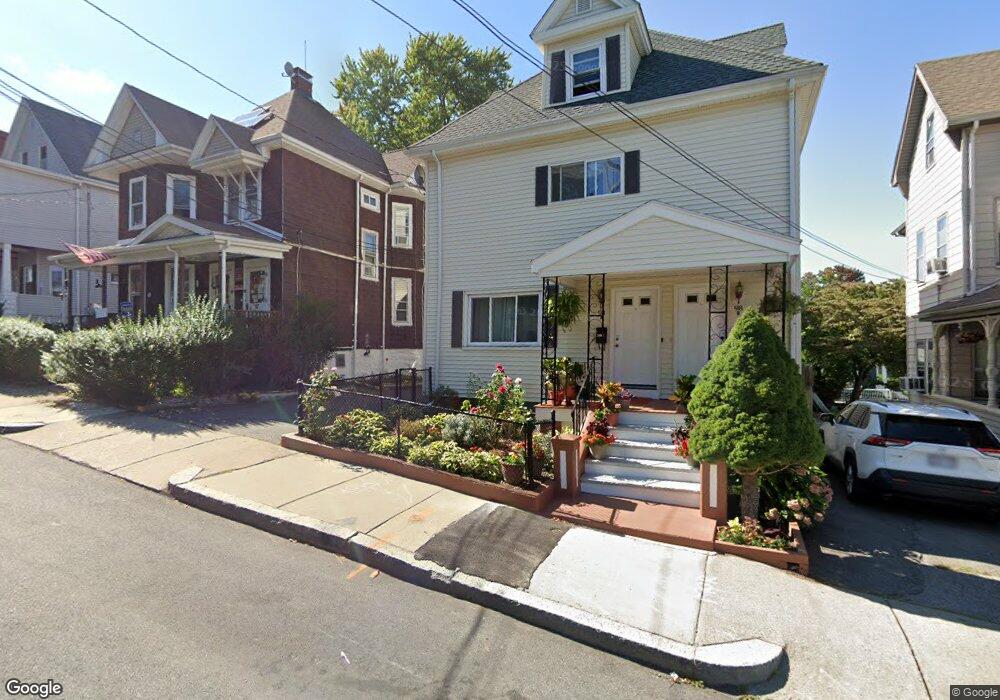
98 Fairmont St Unit 98B Malden, MA 02148
Belmont NeighborhoodEstimated Value: $848,000 - $1,181,000
6
Beds
2
Baths
2,185
Sq Ft
$446/Sq Ft
Est. Value
About This Home
This home is located at 98 Fairmont St Unit 98B, Malden, MA 02148 and is currently estimated at $973,510, approximately $445 per square foot. 98 Fairmont St Unit 98B is a home located in Middlesex County with nearby schools including Malden High School and Cheverus Catholic School.
Ownership History
Date
Name
Owned For
Owner Type
Purchase Details
Closed on
Jun 27, 2016
Sold by
Newton Lynette and Newton Andita
Bought by
Newton Roderick and Newton Lynette
Current Estimated Value
Purchase Details
Closed on
May 30, 2006
Sold by
Marshall Leeann
Bought by
Newton Andita and Newton Lynette
Home Financials for this Owner
Home Financials are based on the most recent Mortgage that was taken out on this home.
Original Mortgage
$387,200
Interest Rate
6.53%
Mortgage Type
Purchase Money Mortgage
Purchase Details
Closed on
Jan 3, 2002
Sold by
98 Fairmont St Rt and Toto Joseph C
Bought by
Marshall Leeann
Purchase Details
Closed on
Apr 6, 1990
Sold by
Pappa Thomas A
Bought by
Toto Joseph C
Purchase Details
Closed on
Jun 9, 1989
Sold by
Mahoney Joseph M
Bought by
Pappa Thomas A
Create a Home Valuation Report for This Property
The Home Valuation Report is an in-depth analysis detailing your home's value as well as a comparison with similar homes in the area
Home Values in the Area
Average Home Value in this Area
Purchase History
| Date | Buyer | Sale Price | Title Company |
|---|---|---|---|
| Newton Roderick | -- | -- | |
| Newton Andita | $484,000 | -- | |
| Marshall Leeann | $375,000 | -- | |
| Toto Joseph C | $155,000 | -- | |
| Toto Joseph C | $155,000 | -- | |
| Pappa Thomas A | $165,000 | -- | |
| Pappa Thomas A | $165,000 | -- |
Source: Public Records
Mortgage History
| Date | Status | Borrower | Loan Amount |
|---|---|---|---|
| Previous Owner | Newton Andita | $387,200 | |
| Previous Owner | Pappa Thomas A | $60,000 | |
| Previous Owner | Pappa Thomas A | $165,000 |
Source: Public Records
Tax History Compared to Growth
Tax History
| Year | Tax Paid | Tax Assessment Tax Assessment Total Assessment is a certain percentage of the fair market value that is determined by local assessors to be the total taxable value of land and additions on the property. | Land | Improvement |
|---|---|---|---|---|
| 2025 | $92 | $811,400 | $291,800 | $519,600 |
| 2024 | $8,965 | $766,900 | $275,600 | $491,300 |
| 2023 | $8,465 | $694,400 | $251,300 | $443,100 |
| 2022 | $8,099 | $655,800 | $227,000 | $428,800 |
| 2021 | $7,761 | $631,500 | $202,700 | $428,800 |
| 2020 | $7,525 | $594,900 | $195,800 | $399,100 |
| 2019 | $7,093 | $534,500 | $186,400 | $348,100 |
| 2018 | $6,803 | $482,800 | $154,000 | $328,800 |
| 2017 | $6,428 | $453,600 | $147,900 | $305,700 |
| 2016 | $5,934 | $391,400 | $135,800 | $255,600 |
| 2015 | $5,751 | $365,600 | $129,300 | $236,300 |
| 2014 | $5,416 | $336,400 | $117,500 | $218,900 |
Source: Public Records
Map
Nearby Homes
- 16 Boylston St
- 13-15 Benner Ave
- 23 Pratt St
- 23 Upham St
- 17 Ashton St
- 272-274 Cross St Unit 1
- 272-274 Cross St Unit 4
- 272-274 Cross St Unit 3
- 272-274 Cross St Unit 5
- 272-274 Cross St Unit 2
- 44 Stevens St
- 72 Ashland St Unit 307
- 210 Hancock St
- 17 Garland Ave
- 32 Central Ave
- 55 Clarendon St
- 89 Judson St
- 98 Bradford St
- 21 Central Ave Unit 10
- 21 Staples Ave Unit 25
- 98-98B Fairmont St
- 96 Fairmont St Unit 96A
- 96 Fairmont St Unit A
- 100 Fairmont St
- 90 Fairmont St Unit 92
- 90 Fairmont St Unit 1
- 2 Winthrop Park
- 3 Winthrop Park
- 99 Fairmont St
- 88 Fairmont St
- 88 Fairmont St Unit 2
- 108 Fairmont St
- 1 Winthrop Park
- 97 Fairmont St
- 87 Fairmont St
- 29 Winthrop St
- 29 Winthrop St Unit 1
- 25 Winthrop St Unit 27
- 109 Fairmont St
- 109 Fairmont St Unit 2