Estimated Value: $530,000 - $729,000
--
Bed
--
Bath
4,356
Sq Ft
$148/Sq Ft
Est. Value
About This Home
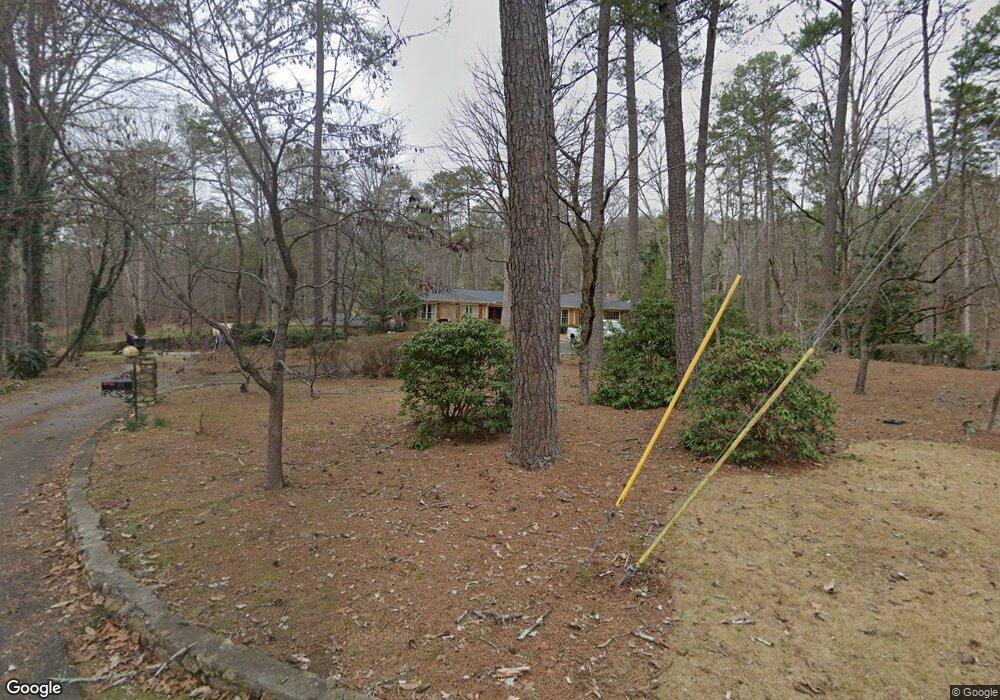
This home is located at 98 Featherston Ct SW, Rome, GA 30165 and is currently estimated at $643,535, approximately $147 per square foot. 98 Featherston Ct SW is a home located in Floyd County with nearby schools including Coosa Middle School and Coosa High School.
Ownership History
Date
Name
Owned For
Owner Type
Purchase Details
Closed on
Mar 4, 2008
Sold by
Not Provided
Bought by
Dulaney Teresa Martens and K A T F
Current Estimated Value
Purchase Details
Closed on
May 31, 2001
Sold by
Martens Lester Joel and Teresa Martens
Bought by
Martens Teresa & First Union Nationa
Purchase Details
Closed on
Dec 28, 1999
Sold by
Beamer Michael A and Beamer Terry M
Bought by
Martens Lester Joel and Teresa Marten
Purchase Details
Closed on
Nov 30, 1990
Sold by
Davis Robert E
Bought by
Beamer Michael A and Beamer Terry M
Purchase Details
Closed on
Jul 27, 1983
Sold by
Davis Kathleen H
Bought by
Davis Robert E
Purchase Details
Closed on
Feb 3, 1977
Sold by
Davis Robert E
Bought by
Davis Kathleen H
Purchase Details
Closed on
Jun 18, 1966
Sold by
P\R
Bought by
Davis Robert E
Purchase Details
Closed on
Jan 2, 1955
Sold by
Foy Ola Mae Parker
Bought by
P\R
Purchase Details
Closed on
Jan 1, 1955
Bought by
Foy Ola Mae Parker
Create a Home Valuation Report for This Property
The Home Valuation Report is an in-depth analysis detailing your home's value as well as a comparison with similar homes in the area
Home Values in the Area
Average Home Value in this Area
Purchase History
| Date | Buyer | Sale Price | Title Company |
|---|---|---|---|
| Dulaney Teresa Martens | -- | -- | |
| Dulaney Teresa Martens | -- | -- | |
| Martens Teresa & First Union Nationa | -- | -- | |
| Martens Lester Joel | $289,000 | -- | |
| Beamer Michael A | $282,500 | -- | |
| Davis Robert E | -- | -- | |
| Davis Kathleen H | -- | -- | |
| Davis Robert E | $42,500 | -- | |
| P\R | -- | -- | |
| Foy Ola Mae Parker | -- | -- |
Source: Public Records
Tax History Compared to Growth
Tax History
| Year | Tax Paid | Tax Assessment Tax Assessment Total Assessment is a certain percentage of the fair market value that is determined by local assessors to be the total taxable value of land and additions on the property. | Land | Improvement |
|---|---|---|---|---|
| 2024 | $5,714 | $251,631 | $81,180 | $170,451 |
| 2023 | $5,691 | $237,464 | $73,800 | $163,664 |
| 2022 | $4,853 | $194,538 | $60,270 | $134,268 |
| 2021 | $4,532 | $173,621 | $54,888 | $118,733 |
| 2020 | $4,335 | $161,945 | $47,729 | $114,216 |
| 2019 | $4,201 | $157,128 | $47,729 | $109,399 |
| 2018 | $4,070 | $149,801 | $45,458 | $104,343 |
| 2017 | $3,934 | $142,299 | $42,091 | $100,208 |
| 2016 | $3,959 | $141,136 | $42,080 | $99,056 |
| 2015 | $3,772 | $135,069 | $42,080 | $92,989 |
| 2014 | $3,772 | $135,069 | $42,080 | $92,989 |
Source: Public Records
Map
Nearby Homes
- 5 Andrea Ct SW
- 0 Featherston Rd SW Unit 10512723
- 0 Featherston Rd SW Unit 13890394
- 202 Green View Rd SW
- 11 Brow Rd SW
- 28 Crestwood Dr SW
- 0 Hidden Ridge Dr Unit 10556470
- 0 Hidden Ridge Dr Unit 10343706
- 0 Hidden Ridge Dr Unit 10343701
- 0 Hidden Ridge Dr Unit 10343700
- 0 Hidden Ridge Dr Unit 10343696
- 0 Hidden Ridge Dr Unit 10343694
- 0 Hidden Ridge Dr Unit 10343693
- 0 Hidden Ridge Dr Unit 10343689
- 0 Hidden Ridge Dr Unit 10343688
- 0 Hidden Ridge Dr Unit 10343685
- 0 Hidden Ridge Dr Unit 10343680
- 0 Hidden Ridge Dr Unit 10343676
- 1 Huntington Rd SW
- 2 Kensington Rd SW
- 93 Featherston Ct SW
- 60 Featherston Ct SW
- 67 Featherston Ct SW
- 83 Dogwood Dr SW
- 43 Featherston Ct SW
- 4 Andrea Ct SW
- 76 Dogwood Dr SW
- 6 Andrea Ct SW
- 8 Andrea Ct SW
- 2 Andrea Ct SW
- 225 Featherston Rd SW
- 0 Featherston Ct SW Unit 8835195
- 0 Featherston Ct SW Unit 8281468
- 0 Andrea Ct SW Unit 8650308
- 10 Andrea Ct SW
- 285 Featherston Rd SW
- 3 Andrea Ct SW
- 100 Shadow Ln SW
- 1 Featherston Ct SW
- 9 Andrea Ct SW