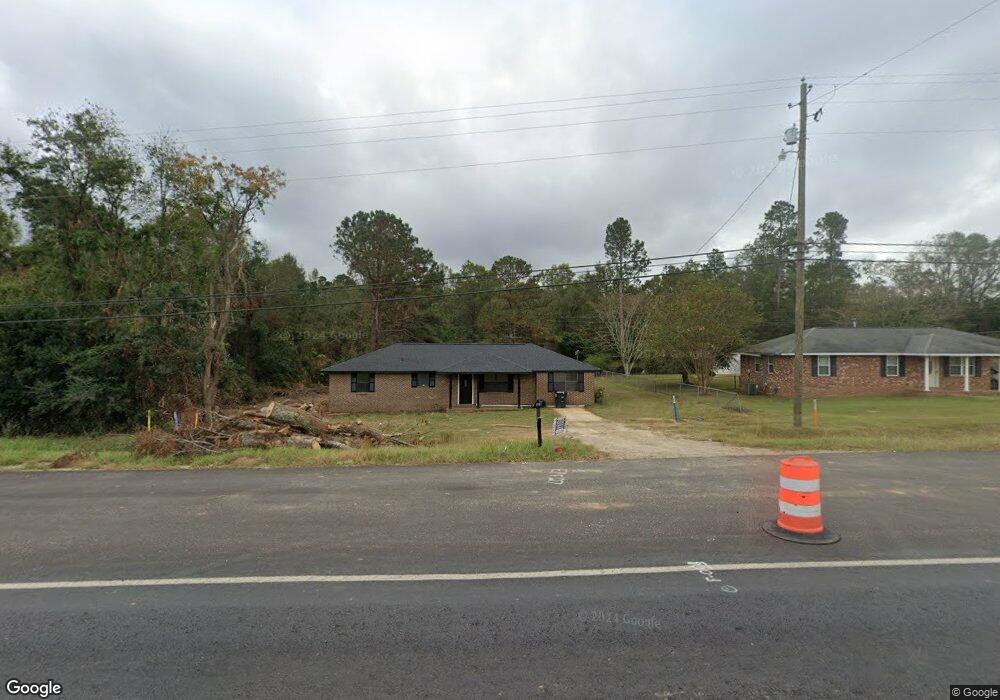
98 Ga Highway 56 N Waynesboro, GA 30830
Estimated Value: $98,000 - $192,000
3
Beds
2
Baths
1,425
Sq Ft
$111/Sq Ft
Est. Value
About This Home
This home is located at 98 Ga Highway 56 N, Waynesboro, GA 30830 and is currently estimated at $157,667, approximately $110 per square foot. 98 Ga Highway 56 N is a home located in Burke County with nearby schools including Burke County High School, Burkehaven Christian School, and Edmund Burke Academy.
Ownership History
Date
Name
Owned For
Owner Type
Purchase Details
Closed on
Jul 24, 2025
Sold by
Taylor Eddie J
Bought by
Waldrop Collin Jason
Current Estimated Value
Home Financials for this Owner
Home Financials are based on the most recent Mortgage that was taken out on this home.
Original Mortgage
$179,685
Outstanding Balance
$179,376
Interest Rate
6.77%
Mortgage Type
FHA
Estimated Equity
-$21,709
Purchase Details
Closed on
Sep 3, 2024
Sold by
Sdla Llc
Bought by
Taylor Eddie J and Taylor Robert William
Purchase Details
Closed on
Sep 14, 2009
Sold by
Oglesby Iris Gail
Bought by
Oglesby Donna G
Home Financials for this Owner
Home Financials are based on the most recent Mortgage that was taken out on this home.
Original Mortgage
$92,391
Interest Rate
5.22%
Mortgage Type
New Conventional
Purchase Details
Closed on
Oct 20, 1995
Bought by
Oglesby Iris Gail
Create a Home Valuation Report for This Property
The Home Valuation Report is an in-depth analysis detailing your home's value as well as a comparison with similar homes in the area
Home Values in the Area
Average Home Value in this Area
Purchase History
| Date | Buyer | Sale Price | Title Company |
|---|---|---|---|
| Waldrop Collin Jason | $183,000 | -- | |
| Taylor Eddie J | $85,000 | -- | |
| Oglesby Donna G | $90,000 | -- | |
| Oglesby Donna G | $90,000 | -- | |
| Oglesby Iris Gail | -- | -- |
Source: Public Records
Mortgage History
| Date | Status | Borrower | Loan Amount |
|---|---|---|---|
| Open | Waldrop Collin Jason | $179,685 | |
| Previous Owner | Oglesby Donna G | $92,391 |
Source: Public Records
Tax History Compared to Growth
Tax History
| Year | Tax Paid | Tax Assessment Tax Assessment Total Assessment is a certain percentage of the fair market value that is determined by local assessors to be the total taxable value of land and additions on the property. | Land | Improvement |
|---|---|---|---|---|
| 2024 | $1,047 | $53,666 | $2,000 | $51,666 |
| 2023 | $1,141 | $53,404 | $3,000 | $50,404 |
| 2022 | $1,003 | $46,981 | $3,000 | $43,981 |
| 2021 | $863 | $39,436 | $3,000 | $36,436 |
| 2020 | $864 | $39,436 | $3,000 | $36,436 |
| 2019 | $774 | $34,704 | $3,000 | $31,704 |
| 2018 | $745 | $33,404 | $3,000 | $30,404 |
| 2017 | $700 | $31,306 | $3,000 | $28,306 |
| 2016 | $663 | $29,428 | $3,000 | $26,428 |
| 2015 | $687 | $30,248 | $3,000 | $27,249 |
| 2014 | $692 | $30,249 | $3,000 | $27,249 |
| 2013 | -- | $30,248 | $3,000 | $27,248 |
Source: Public Records
Map
Nearby Homes
- 711 Stone Ave
- 0 Highway 25 S Unit 452487
- 509 E 6th St
- 0 Railroad Ave
- 825 Railroad Ave
- 827 Railroad Ave
- 829 Railroad Ave
- 0000 Georgia 56
- 816 Perry St
- 875 Waters St
- 1105 Waters St
- 413 S Liberty St
- 117 E 13th St
- 403 Shadrack St
- 818 Academy Ave
- 855 Academy Ave
- 425 Jones Ave
- 413 Jones Ave
- 412 W 9th St
- 462 W 4th St
- 96 Ga Highway 56 N
- 94 Ga Highway 56 N
- 94 Ga Highway 56 N
- 92 Ga Highway 56 N
- 1203 Leslee Dr
- 1201 Leslee Dr
- 1210 Leslie Dr
- 0 Leslie Dr
- 1205 Leslee Dr
- 1202 Leslee Dr
- 1204 Leslee Dr
- 1207 Leslee Dr
- 1209 Leslee Dr
- 1211 Leslee Dr
- 1212 Susan Ct
- 1206 Leslee Dr
- 82 Ga Highway 56 N
- 1213 Leslee Dr
- 1214 Susan Ct
- 1208 Leslee Dr