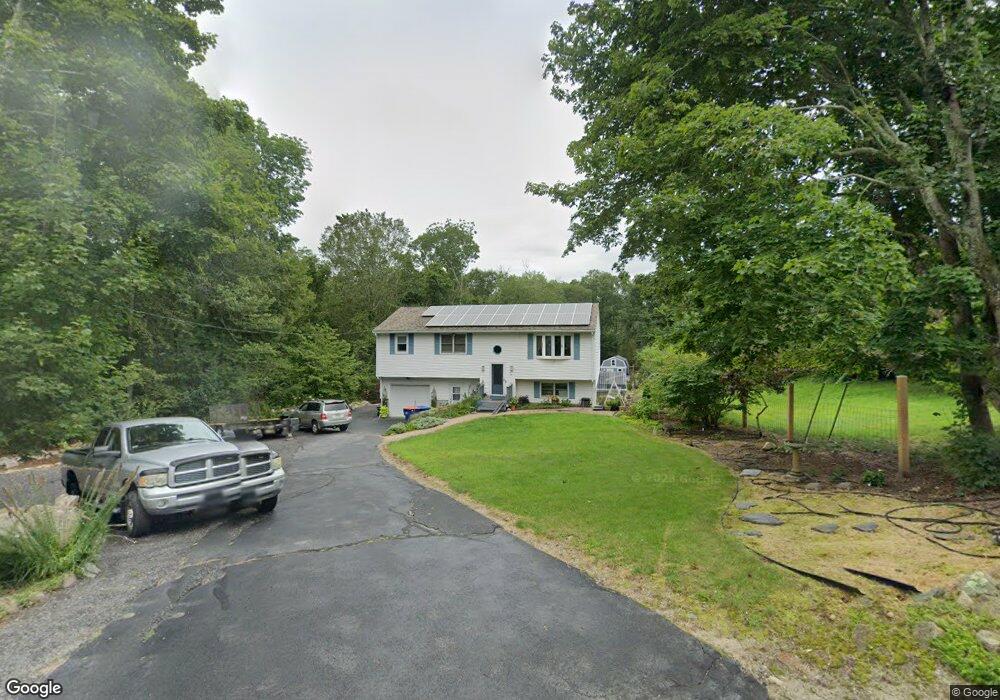
98 Gifford Rd Westport, MA 02790
North Westport NeighborhoodEstimated Value: $415,000 - $587,000
3
Beds
--
Bath
1,182
Sq Ft
$428/Sq Ft
Est. Value
About This Home
This home is located at 98 Gifford Rd, Westport, MA 02790 and is currently estimated at $506,316, approximately $428 per square foot. 98 Gifford Rd is a home located in Bristol County with nearby schools including Alice A. Macomber Primary School, Westport Elementary School, and Westport Middle-High School.
Ownership History
Date
Name
Owned For
Owner Type
Purchase Details
Closed on
Jul 7, 2000
Sold by
Freitas Anthony F
Bought by
Ferreira Patricia Lc
Current Estimated Value
Purchase Details
Closed on
Nov 30, 1993
Sold by
Fleming Eng & Bldg
Bought by
Freitas Anthony F
Home Financials for this Owner
Home Financials are based on the most recent Mortgage that was taken out on this home.
Original Mortgage
$124,000
Interest Rate
6.72%
Mortgage Type
Purchase Money Mortgage
Create a Home Valuation Report for This Property
The Home Valuation Report is an in-depth analysis detailing your home's value as well as a comparison with similar homes in the area
Home Values in the Area
Average Home Value in this Area
Purchase History
| Date | Buyer | Sale Price | Title Company |
|---|---|---|---|
| Ferreira Patricia Lc | $111,416 | -- | |
| Freitas Anthony F | $134,000 | -- |
Source: Public Records
Mortgage History
| Date | Status | Borrower | Loan Amount |
|---|---|---|---|
| Open | Freitas Anthony F | $180,000 | |
| Closed | Freitas Anthony F | $100,000 | |
| Closed | Freitas Anthony F | $75,000 | |
| Previous Owner | Freitas Anthony F | $124,000 |
Source: Public Records
Tax History Compared to Growth
Tax History
| Year | Tax Paid | Tax Assessment Tax Assessment Total Assessment is a certain percentage of the fair market value that is determined by local assessors to be the total taxable value of land and additions on the property. | Land | Improvement |
|---|---|---|---|---|
| 2025 | $3,158 | $423,900 | $193,100 | $230,800 |
| 2024 | $3,087 | $399,400 | $171,900 | $227,500 |
| 2023 | $2,961 | $362,900 | $156,900 | $206,000 |
| 2022 | $2,970 | $350,200 | $156,900 | $193,300 |
| 2021 | $2,690 | $312,100 | $130,100 | $182,000 |
| 2020 | $2,589 | $307,100 | $125,100 | $182,000 |
| 2019 | $2,419 | $292,500 | $125,100 | $167,400 |
| 2018 | $2,300 | $281,500 | $122,800 | $158,700 |
| 2017 | $2,124 | $266,500 | $119,000 | $147,500 |
| 2016 | $1,987 | $251,200 | $115,300 | $135,900 |
| 2015 | $2,021 | $254,800 | $117,800 | $137,000 |
Source: Public Records
Map
Nearby Homes