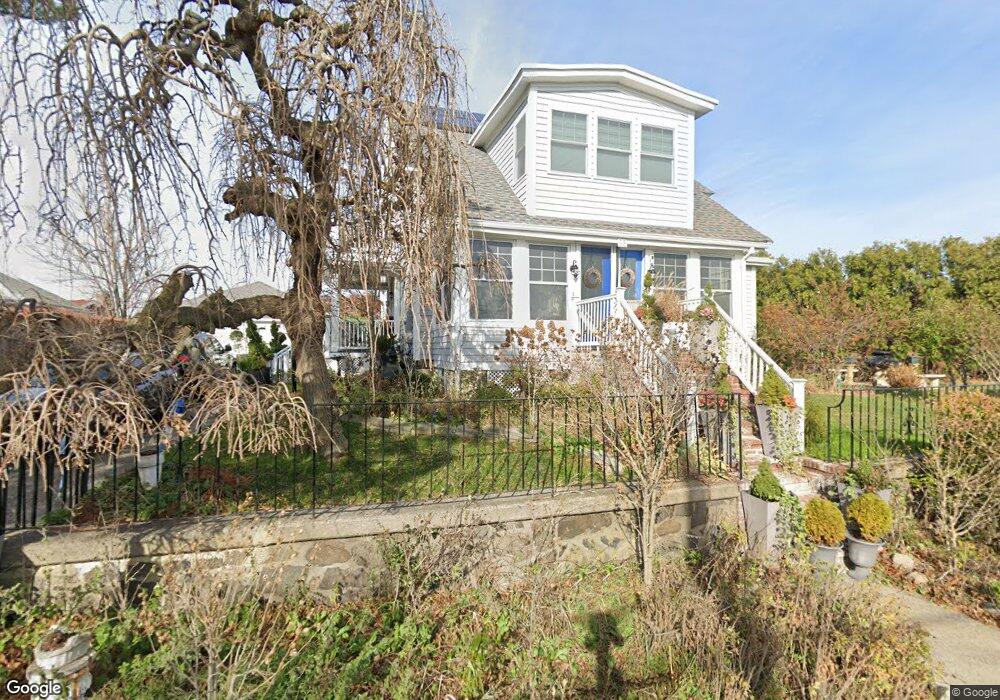
98 Little Nahant Rd Nahant, MA 01908
Estimated Value: $1,043,000 - $1,225,000
3
Beds
2
Baths
2,081
Sq Ft
$530/Sq Ft
Est. Value
About This Home
This home is located at 98 Little Nahant Rd, Nahant, MA 01908 and is currently estimated at $1,103,578, approximately $530 per square foot. 98 Little Nahant Rd is a home located in Essex County with nearby schools including Johnson Elementary School, Swampscott Middle School, and Swampscott High School.
Ownership History
Date
Name
Owned For
Owner Type
Purchase Details
Closed on
Jun 9, 2021
Sold by
Butera Charles J
Bought by
Charles J Butera Ret and Butera
Current Estimated Value
Purchase Details
Closed on
Jun 16, 1986
Bought by
Butera Charles J
Create a Home Valuation Report for This Property
The Home Valuation Report is an in-depth analysis detailing your home's value as well as a comparison with similar homes in the area
Home Values in the Area
Average Home Value in this Area
Purchase History
| Date | Buyer | Sale Price | Title Company |
|---|---|---|---|
| Charles J Butera Ret | -- | None Available | |
| Charles J Butera Ret | -- | None Available | |
| Butera Charles J | -- | -- |
Source: Public Records
Tax History Compared to Growth
Tax History
| Year | Tax Paid | Tax Assessment Tax Assessment Total Assessment is a certain percentage of the fair market value that is determined by local assessors to be the total taxable value of land and additions on the property. | Land | Improvement |
|---|---|---|---|---|
| 2025 | $9,557 | $1,044,500 | $582,200 | $462,300 |
| 2024 | $9,270 | $1,022,100 | $559,800 | $462,300 |
| 2023 | $8,826 | $971,000 | $526,200 | $444,800 |
| 2022 | $8,104 | $827,800 | $425,500 | $402,300 |
| 2021 | $7,983 | $759,600 | $380,700 | $378,900 |
| 2020 | $7,212 | $657,400 | $380,700 | $276,700 |
| 2019 | $6,389 | $585,600 | $335,900 | $249,700 |
| 2018 | $5,947 | $580,200 | $335,900 | $244,300 |
| 2017 | $6,085 | $581,200 | $335,900 | $245,300 |
| 2016 | $5,788 | $550,200 | $324,700 | $225,500 |
| 2015 | $5,336 | $488,600 | $263,100 | $225,500 |
| 2014 | $5,404 | $489,900 | $263,100 | $226,800 |
Source: Public Records
Map
Nearby Homes
- 36 Lennox Rd
- 9 Little Nahant Rd
- 66 Ocean St
- 23 Phillips Rd
- 17 Pearl Rd
- 43 Maple Ave
- 303 Nahant Rd
- 2 Goddard Dr
- 183 Bass Point Rd
- 51 Cliff St
- 3 Cliff St
- 9 Beach Rd Unit 4
- 45 Tudor St Unit 3-8
- 41 Tudor St
- 12 Chancery Ct Unit 205
- 12 Chancery Ct Unit 207
- 98 Lynnway Unit 102
- 300 Lynn Shore Dr Unit 612
- 107 Lynnway
- 154 Lynnway Unit 520
- 90 Little Nahant Rd
- 102 Little Nahant Rd
- 193 Wilson Rd
- 111 Little Nahant Rd
- 88 Little Nahant Rd
- 121 Little Nahant Rd
- 119 Little Nahant Rd Unit NAHANT
- 244 Wilson Rd
- 238 Wilson Rd
- 234 Wilson Rd
- 246 Wilson Rd
- 240 Wilson Rd
- 101 Little Nahant Rd
- 191 Wilson Rd
- 93 Little Nahant Rd
- 86 Little Nahant Rd
- 95 Little Nahant Rd
- 230 Wilson Rd
- 230 Wilson Rd Unit 2
- 230 Wilson Rd Unit 1