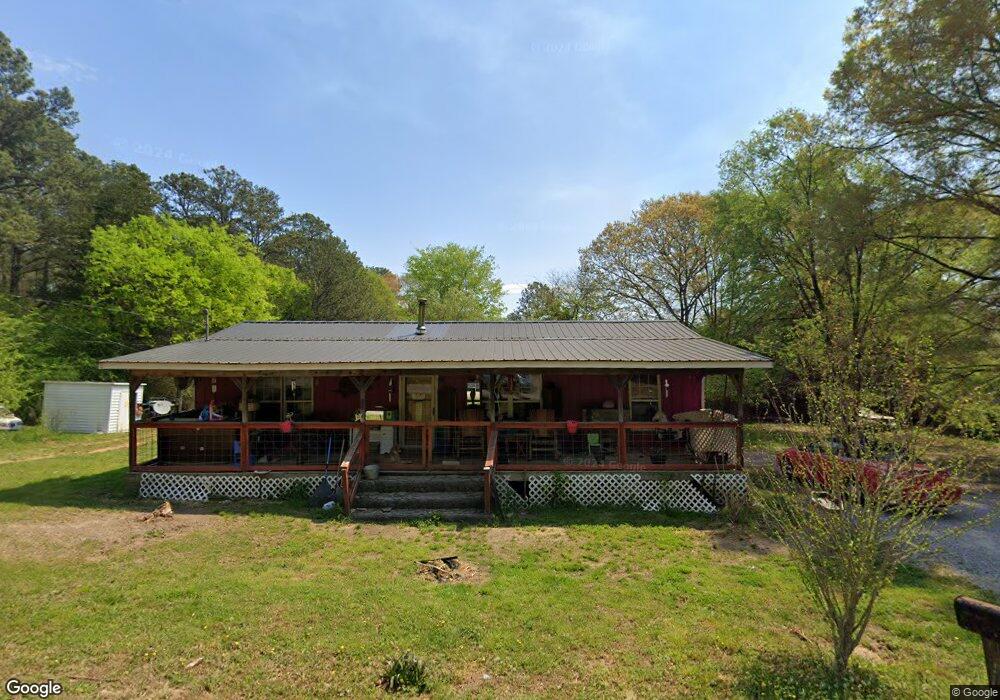
98 Roper Rd Aragon, GA 30104
Estimated Value: $158,000 - $246,000
3
Beds
2
Baths
1,128
Sq Ft
$164/Sq Ft
Est. Value
About This Home
This home is located at 98 Roper Rd, Aragon, GA 30104 and is currently estimated at $184,476, approximately $163 per square foot. 98 Roper Rd is a home located in Polk County with nearby schools including Rockmart Middle School.
Ownership History
Date
Name
Owned For
Owner Type
Purchase Details
Closed on
Jul 1, 1994
Sold by
Thomas Discount Company
Bought by
Albert Terry and Albert Jerrell
Current Estimated Value
Purchase Details
Closed on
Mar 6, 1989
Sold by
Kinamore Herman D
Bought by
Thomas Discount Co
Purchase Details
Closed on
Sep 1, 1987
Sold by
Kinamore Herman D
Bought by
Thomas Discount Co
Purchase Details
Closed on
Aug 23, 1983
Sold by
Forsyth Dan
Bought by
Kinamore H D
Purchase Details
Closed on
May 1, 1982
Sold by
Dover Ralph
Bought by
Forsyth Dan
Purchase Details
Closed on
Apr 9, 1982
Bought by
Dover Ralph
Create a Home Valuation Report for This Property
The Home Valuation Report is an in-depth analysis detailing your home's value as well as a comparison with similar homes in the area
Purchase History
| Date | Buyer | Sale Price | Title Company |
|---|---|---|---|
| Albert Terry | $29,900 | -- | |
| Thomas Discount Co | $34,000 | -- | |
| Thomas Discount Co | $35,800 | -- | |
| Kinamore H D | -- | -- | |
| Forsyth Dan | -- | -- | |
| Dover Ralph | -- | -- |
Source: Public Records
Tax History
| Year | Tax Paid | Tax Assessment Tax Assessment Total Assessment is a certain percentage of the fair market value that is determined by local assessors to be the total taxable value of land and additions on the property. | Land | Improvement |
|---|---|---|---|---|
| 2025 | $781 | $42,480 | $1,932 | $40,548 |
| 2024 | $781 | $39,358 | $1,420 | $37,938 |
| 2023 | $591 | $26,884 | $1,420 | $25,464 |
| 2022 | $505 | $23,287 | $947 | $22,340 |
| 2021 | $512 | $23,287 | $947 | $22,340 |
| 2020 | $473 | $21,641 | $947 | $20,694 |
| 2019 | $494 | $20,391 | $947 | $19,444 |
| 2018 | $491 | $19,828 | $947 | $18,881 |
| 2017 | $485 | $19,828 | $947 | $18,881 |
| 2016 | $489 | $19,981 | $1,100 | $18,881 |
| 2015 | $507 | $20,570 | $1,100 | $19,470 |
| 2014 | $511 | $20,570 | $1,100 | $19,470 |
Source: Public Records
Map
Nearby Homes
- 3750 Rome Hwy
- 95 Cashtown Rd
- 62 Morgan Rd
- 156 Dogwood Glen Dr
- 1638 Prospect Rd
- 65 Long Station Rd
- 430 June Kemp Rd
- 1111 Old Collard Valley Rd
- 11 Magnolia St
- 452 Terry White Rd
- 1216 N Bellview Rd
- 15 Aragon Rd
- 4526 Rome Hwy
- 0 Rome Hwy 101 Unit 25352772
- 34 Elm St
- 58 Elm St
- 30 Oak St
- 66 Elm St
- 54 Taylorsville Rd
- 100 Hixville Rd
Your Personal Tour Guide
Ask me questions while you tour the home.