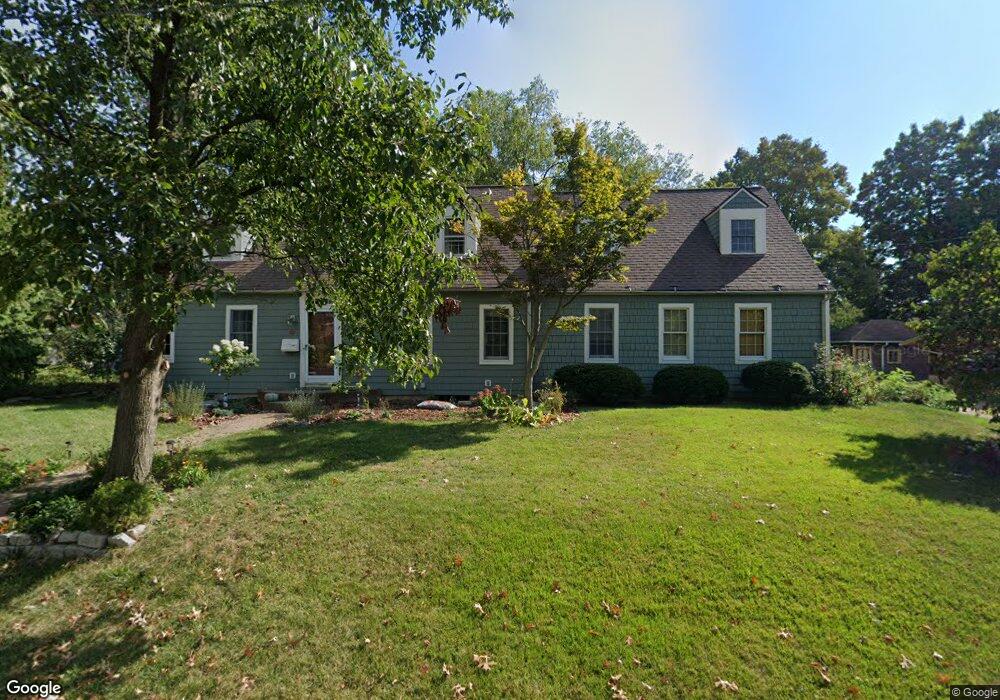
98 S Grove St Westerville, OH 43081
Estimated Value: $510,000 - $623,000
4
Beds
4
Baths
2,834
Sq Ft
$205/Sq Ft
Est. Value
About This Home
This home is located at 98 S Grove St, Westerville, OH 43081 and is currently estimated at $581,115, approximately $205 per square foot. 98 S Grove St is a home located in Franklin County with nearby schools including Whittier Elementary School, Blendon Middle School, and Westerville South High School.
Ownership History
Date
Name
Owned For
Owner Type
Purchase Details
Closed on
May 21, 2015
Sold by
Yoest Jeffrey P and Yoest Sarah W
Bought by
Johnson Erin H and Johnson Jonathan D
Current Estimated Value
Home Financials for this Owner
Home Financials are based on the most recent Mortgage that was taken out on this home.
Original Mortgage
$260,000
Outstanding Balance
$199,931
Interest Rate
3.63%
Mortgage Type
New Conventional
Estimated Equity
$381,184
Purchase Details
Closed on
May 22, 2002
Sold by
Yoest Jeffrey P and Yoest Sarah W
Bought by
Yoest Jeffrey P and Yoest Sarah Warne
Purchase Details
Closed on
Apr 5, 1984
Bought by
Yoest Jeffrey P
Create a Home Valuation Report for This Property
The Home Valuation Report is an in-depth analysis detailing your home's value as well as a comparison with similar homes in the area
Home Values in the Area
Average Home Value in this Area
Purchase History
| Date | Buyer | Sale Price | Title Company |
|---|---|---|---|
| Johnson Erin H | $300,000 | Crown Title | |
| Yoest Jeffrey P | -- | -- | |
| Yoest Jeffrey P | $60,000 | -- |
Source: Public Records
Mortgage History
| Date | Status | Borrower | Loan Amount |
|---|---|---|---|
| Open | Johnson Erin H | $260,000 |
Source: Public Records
Tax History Compared to Growth
Tax History
| Year | Tax Paid | Tax Assessment Tax Assessment Total Assessment is a certain percentage of the fair market value that is determined by local assessors to be the total taxable value of land and additions on the property. | Land | Improvement |
|---|---|---|---|---|
| 2024 | $9,611 | $169,120 | $40,810 | $128,310 |
| 2023 | $9,408 | $169,120 | $40,810 | $128,310 |
| 2022 | $10,070 | $138,220 | $30,630 | $107,590 |
| 2021 | $9,160 | $124,680 | $30,630 | $94,050 |
| 2020 | $9,134 | $124,680 | $30,630 | $94,050 |
| 2019 | $7,765 | $100,070 | $30,630 | $69,440 |
| 2018 | $7,117 | $100,070 | $30,630 | $69,440 |
| 2017 | $7,237 | $100,070 | $30,630 | $69,440 |
| 2016 | $6,837 | $81,550 | $28,630 | $52,920 |
| 2015 | $6,622 | $81,550 | $28,630 | $52,920 |
| 2014 | $6,627 | $81,550 | $28,630 | $52,920 |
| 2013 | $3,151 | $77,665 | $27,265 | $50,400 |
Source: Public Records
Map
Nearby Homes
- 79 W Park St
- 53 W College Ave
- 160 N State St
- 92 N Vine St
- 175 N State St
- 247 Foxtrail Place
- 199 E College Ave
- 502 Foxtrail Cir E Unit 502
- 101 W Ticonderoga Dr Unit B
- 134 W Ticonderoga Dr Unit D
- 107 W Ticonderoga Dr Unit 3E
- 106 E Ticonderoga Dr
- 106 E Ticonderoga Dr Unit A
- 470 S State St
- 466 S State St
- 385 Hockberry Ave Unit Lot 1603
- 325 Vannette Ln Unit Lot 602
- 476 S State St
- 317 Vannette Ln Unit Lot 604
- Highwood Plan at Towns on the Greenway