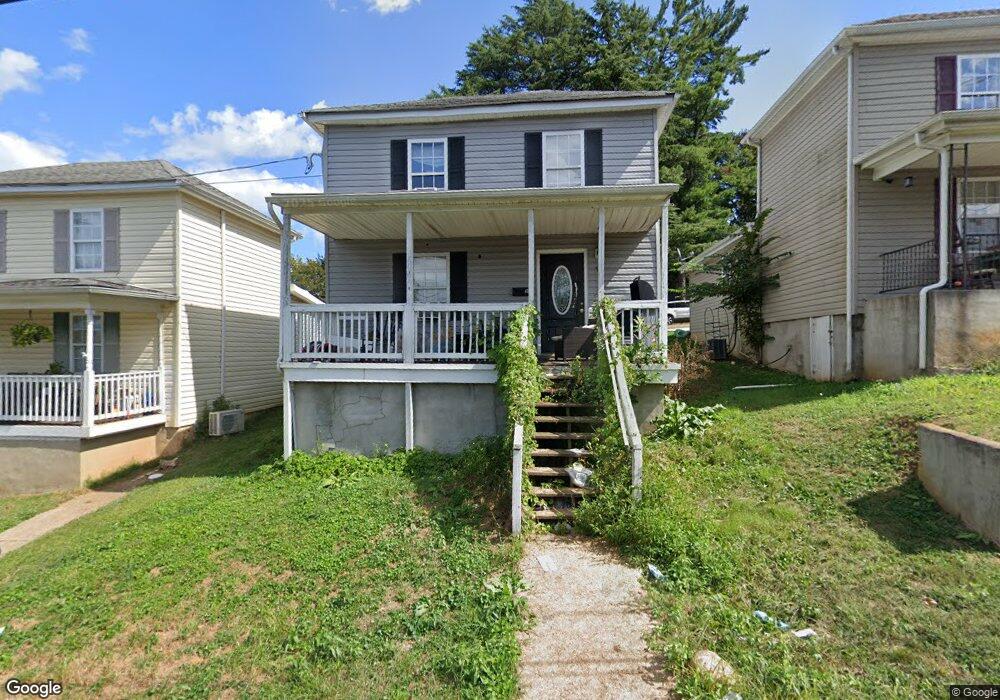
98 Willow St Lynchburg, VA 24503
Daniel's Hill NeighborhoodEstimated Value: $114,000 - $168,285
3
Beds
2
Baths
1,260
Sq Ft
$110/Sq Ft
Est. Value
About This Home
This home is located at 98 Willow St, Lynchburg, VA 24503 and is currently estimated at $138,571, approximately $109 per square foot. 98 Willow St is a home located in Lynchburg City with nearby schools including Bedford Hills Elementary School, Linkhorne Middle School, and E.C. Glass High School.
Ownership History
Date
Name
Owned For
Owner Type
Purchase Details
Closed on
Sep 13, 2019
Sold by
Charter Capital Llc
Bought by
Profits Llc
Current Estimated Value
Home Financials for this Owner
Home Financials are based on the most recent Mortgage that was taken out on this home.
Original Mortgage
$48,000
Outstanding Balance
$42,044
Interest Rate
3.6%
Mortgage Type
New Conventional
Estimated Equity
$96,527
Purchase Details
Closed on
Apr 21, 2008
Sold by
Jons Edward D and Jones Clara M
Bought by
Engineered Systems Llc
Create a Home Valuation Report for This Property
The Home Valuation Report is an in-depth analysis detailing your home's value as well as a comparison with similar homes in the area
Home Values in the Area
Average Home Value in this Area
Purchase History
| Date | Buyer | Sale Price | Title Company |
|---|---|---|---|
| Profits Llc | $60,000 | Fidelity National Title | |
| Engineered Systems Llc | $49,000 | Fidelity National Title Ins |
Source: Public Records
Mortgage History
| Date | Status | Borrower | Loan Amount |
|---|---|---|---|
| Open | Profits Llc | $48,000 |
Source: Public Records
Tax History Compared to Growth
Tax History
| Year | Tax Paid | Tax Assessment Tax Assessment Total Assessment is a certain percentage of the fair market value that is determined by local assessors to be the total taxable value of land and additions on the property. | Land | Improvement |
|---|---|---|---|---|
| 2025 | $1,095 | $130,300 | $18,000 | $112,300 |
| 2024 | $953 | $107,100 | $13,500 | $93,600 |
| 2023 | $953 | $107,100 | $13,500 | $93,600 |
| 2022 | $975 | $94,700 | $9,000 | $85,700 |
| 2021 | $263 | $94,700 | $9,000 | $85,700 |
| 2020 | $192 | $91,700 | $6,000 | $85,700 |
| 2019 | $192 | $91,700 | $6,000 | $85,700 |
| 2018 | $48 | $91,700 | $6,000 | $85,700 |
| 2017 | $192 | $91,700 | $6,000 | $85,700 |
| 2016 | $192 | $91,700 | $6,000 | $85,700 |
| 2015 | $48 | $88,700 | $3,000 | $85,700 |
| 2014 | $40 | $88,700 | $3,000 | $85,700 |
Source: Public Records
Map
Nearby Homes