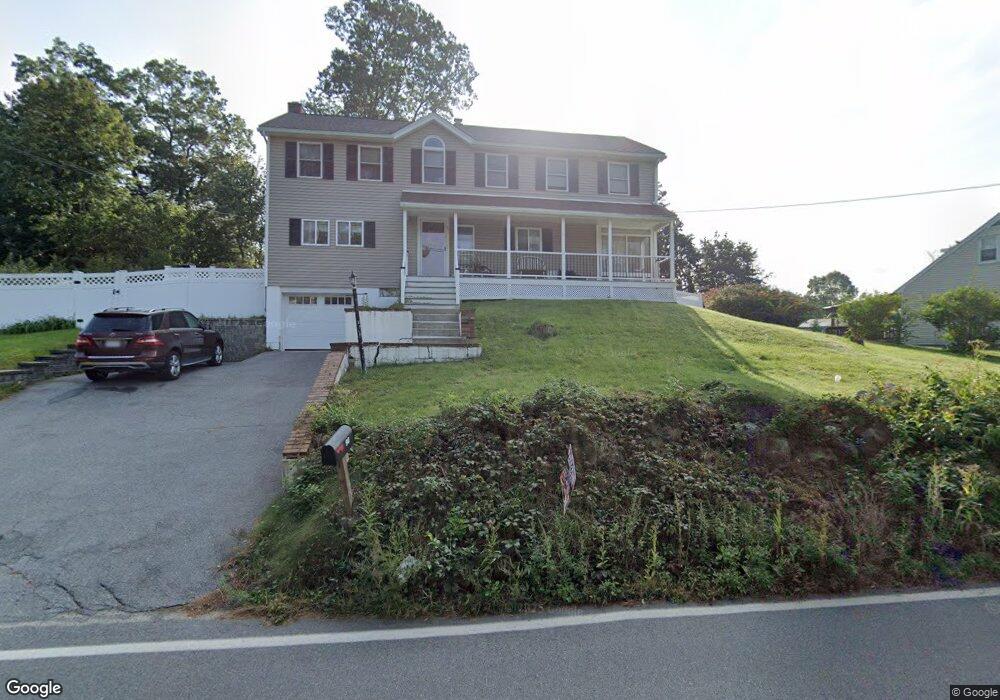
98 Woburn St Wilmington, MA 01887
Estimated Value: $668,000 - $835,000
3
Beds
2
Baths
1,176
Sq Ft
$634/Sq Ft
Est. Value
About This Home
This home is located at 98 Woburn St, Wilmington, MA 01887 and is currently estimated at $745,959, approximately $634 per square foot. 98 Woburn St is a home located in Middlesex County with nearby schools including Wilmington Middle School, Wilmington High School, and Abundant Life Christian School and Childcare.
Ownership History
Date
Name
Owned For
Owner Type
Purchase Details
Closed on
Apr 28, 1997
Sold by
Rispin Lawrence W
Bought by
Tendyke Keith
Current Estimated Value
Purchase Details
Closed on
Oct 30, 1996
Sold by
Morgan Thomas E and Morgan Susan
Bought by
Piantedosi Jennifer
Purchase Details
Closed on
Mar 2, 1988
Sold by
Vigliotti Ronald A
Bought by
Morgan Thomas E
Create a Home Valuation Report for This Property
The Home Valuation Report is an in-depth analysis detailing your home's value as well as a comparison with similar homes in the area
Home Values in the Area
Average Home Value in this Area
Purchase History
| Date | Buyer | Sale Price | Title Company |
|---|---|---|---|
| Tendyke Keith | $127,300 | -- | |
| Piantedosi Jennifer | $161,000 | -- | |
| Morgan Thomas E | $172,000 | -- |
Source: Public Records
Mortgage History
| Date | Status | Borrower | Loan Amount |
|---|---|---|---|
| Open | Morgan Thomas E | $401,250 | |
| Closed | Morgan Thomas E | $16,000 |
Source: Public Records
Tax History Compared to Growth
Tax History
| Year | Tax Paid | Tax Assessment Tax Assessment Total Assessment is a certain percentage of the fair market value that is determined by local assessors to be the total taxable value of land and additions on the property. | Land | Improvement |
|---|---|---|---|---|
| 2025 | $7,907 | $690,600 | $273,600 | $417,000 |
| 2024 | $7,750 | $678,000 | $273,600 | $404,400 |
| 2023 | $7,244 | $606,700 | $248,800 | $357,900 |
| 2022 | $6,828 | $524,000 | $207,300 | $316,700 |
| 2021 | $6,793 | $490,800 | $188,400 | $302,400 |
| 2020 | $6,525 | $480,500 | $188,400 | $292,100 |
| 2019 | $6,346 | $461,500 | $179,400 | $282,100 |
| 2018 | $6,215 | $431,300 | $170,900 | $260,400 |
| 2017 | $5,994 | $414,800 | $164,500 | $250,300 |
| 2016 | $5,600 | $382,800 | $156,700 | $226,100 |
| 2015 | $5,494 | $382,300 | $156,700 | $225,600 |
| 2014 | $5,161 | $362,400 | $149,200 | $213,200 |
Source: Public Records
Map
Nearby Homes
- 1 Evans Dr
- 12 Lockwood Rd
- 220 Martins Landing Unit 309
- 260 Martins Landing Unit 508
- 260 Martins Landing Unit 103
- 3 Oakdale Rd
- 300 Martins Landing Unit 107
- 320 Martins Landing Unit 108
- 320 Martins Landing Unit 109
- 320 Martins Landing Unit 110
- 320 Martins Landing Unit 303
- 320 Martins Landing Unit 102
- 320 Martins Landing Unit 103
- 320 Martins Landing Unit 2410
- 320 Martins Landing Unit 403
- 320 Martins Landing Unit 2201
- 320 Martins Landing Unit 112
- 320 Martins Landing Unit 206
- 320 Martins Landing Unit 2307
- 320 Martins Landing Unit 302