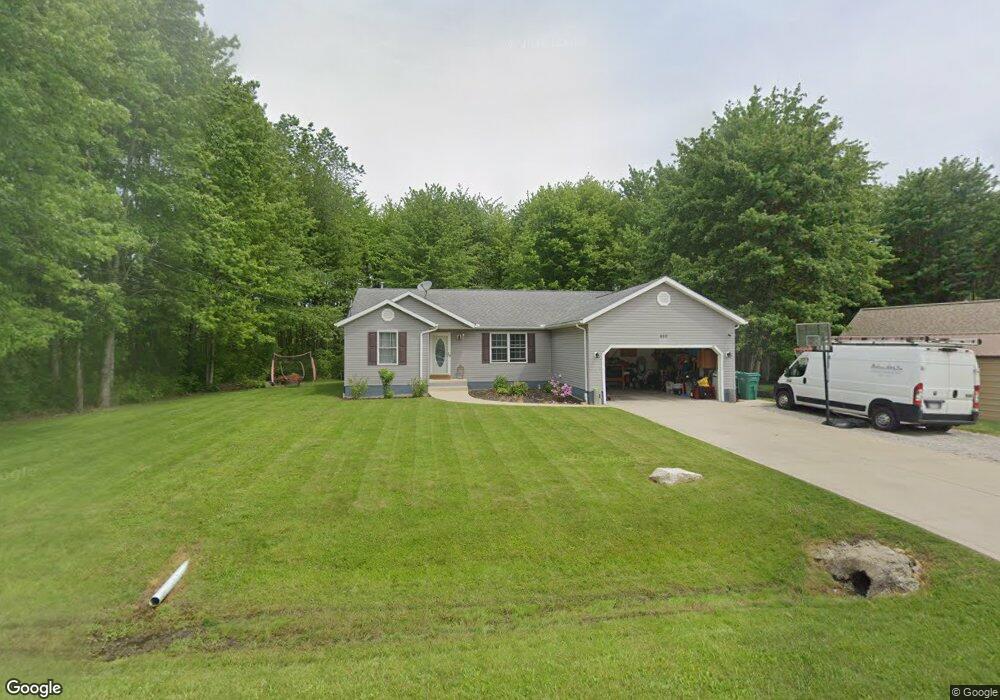
980 Long Shadow Ln Roaming Shores, OH 44085
Estimated Value: $241,404 - $334,000
3
Beds
2
Baths
1,525
Sq Ft
$178/Sq Ft
Est. Value
About This Home
This home is located at 980 Long Shadow Ln, Roaming Shores, OH 44085 and is currently estimated at $271,101, approximately $177 per square foot. 980 Long Shadow Ln is a home located in Ashtabula County with nearby schools including Grand Valley Elementary School, Grand Valley Middle School, and Grand Valley High School.
Ownership History
Date
Name
Owned For
Owner Type
Purchase Details
Closed on
Jun 2, 2010
Sold by
Phillips Richard and Phillips Dianne
Bought by
Zupancic John C
Current Estimated Value
Home Financials for this Owner
Home Financials are based on the most recent Mortgage that was taken out on this home.
Original Mortgage
$137,653
Outstanding Balance
$93,021
Interest Rate
5.14%
Mortgage Type
New Conventional
Estimated Equity
$178,080
Purchase Details
Closed on
Aug 30, 2007
Sold by
Morgan Michael
Bought by
The Bank Of New York Trust Co Na and Jpmorgan Chase Bank Na
Purchase Details
Closed on
Aug 15, 2007
Sold by
The Bank Of New York Trust Co Na
Bought by
Phillips Richard and Phillips Dianne
Purchase Details
Closed on
Jul 26, 2005
Sold by
Soltese Builders Inc
Bought by
Morgan Michael and Morgan Kimberly
Home Financials for this Owner
Home Financials are based on the most recent Mortgage that was taken out on this home.
Original Mortgage
$146,000
Interest Rate
9.8%
Mortgage Type
Fannie Mae Freddie Mac
Purchase Details
Closed on
Jun 9, 2004
Sold by
Nieder Dwayne A and Nieder Shiela L
Bought by
Soltese Builders Inc
Create a Home Valuation Report for This Property
The Home Valuation Report is an in-depth analysis detailing your home's value as well as a comparison with similar homes in the area
Home Values in the Area
Average Home Value in this Area
Purchase History
| Date | Buyer | Sale Price | Title Company |
|---|---|---|---|
| Zupancic John C | $134,900 | Chicago Title | |
| The Bank Of New York Trust Co Na | $82,000 | Resource Title Agency Inc | |
| Phillips Richard | $108,000 | Resource Title Agency Inc | |
| Morgan Michael | $146,000 | Midland Title | |
| Soltese Builders Inc | $1,500 | Midland Title |
Source: Public Records
Mortgage History
| Date | Status | Borrower | Loan Amount |
|---|---|---|---|
| Open | Zupancic John C | $137,653 | |
| Previous Owner | Morgan Michael | $146,000 |
Source: Public Records
Tax History Compared to Growth
Tax History
| Year | Tax Paid | Tax Assessment Tax Assessment Total Assessment is a certain percentage of the fair market value that is determined by local assessors to be the total taxable value of land and additions on the property. | Land | Improvement |
|---|---|---|---|---|
| 2024 | $4,909 | $61,500 | $7,280 | $54,220 |
| 2023 | $2,719 | $61,500 | $7,280 | $54,220 |
| 2022 | $2,511 | $50,790 | $5,600 | $45,190 |
| 2021 | $2,494 | $50,790 | $5,600 | $45,190 |
| 2020 | $2,396 | $50,790 | $5,600 | $45,190 |
| 2019 | $2,162 | $44,840 | $3,640 | $41,200 |
| 2018 | $2,121 | $44,840 | $3,640 | $41,200 |
| 2017 | $2,120 | $44,840 | $3,640 | $41,200 |
| 2016 | $2,234 | $44,840 | $3,640 | $41,200 |
| 2015 | $2,222 | $44,840 | $3,640 | $41,200 |
| 2014 | $2,161 | $44,840 | $3,640 | $41,200 |
| 2013 | $1,770 | $37,700 | $3,500 | $34,200 |
Source: Public Records
Map
Nearby Homes
- 986 Evening Star Dr
- 952 Lunar Ln
- 1437 Lake Vue Dr
- 1129 Lake Vue Dr
- 1497 Morning Star Dr
- 1315 Morning Star Dr
- 0 US Route 6 Unit 5161661
- 1749 Morning Star Dr
- 1629 Sugar Creek Dr
- 1250 Way Rd
- 1602 Pierpont Dr
- 1603 Pierpont Dr
- 748 Rome Rock Creek Rd
- 519 Rome Rock Creek Rd
- 62 Rockaway Dr
- 5174 Ohio 46
- 683 Rome Rock Creek Rd
- 5252 State Route 45
- 2018 Flame Lake Dr
- 2069 S Park Ln
- 981 Long Shadow Ln
- 971 Long Shadow Ln
- 968 Long Shadow Ln
- 957 Sunset Cir
- 882 Long Shadow Ln
- 878 Long Shadow Ln
- 976 Long Shadow Ln
- 954 Lunar Ln
- 883 Long Shadow Ln
- 966 Lunar Ln
- 884 Long Shadow Ln
- 899 Lunar Ln
- 988 Evening Star Dr
- 960 Park Ln
- 879 VL Long Shadow Ln
- 951 Sunset Cir
- 886 Long Shadow Ln
- 0 Sunset Cir Unit 2506065
- 0 Sunset Cir Unit 3388975
- 974 Long Shadow Ln