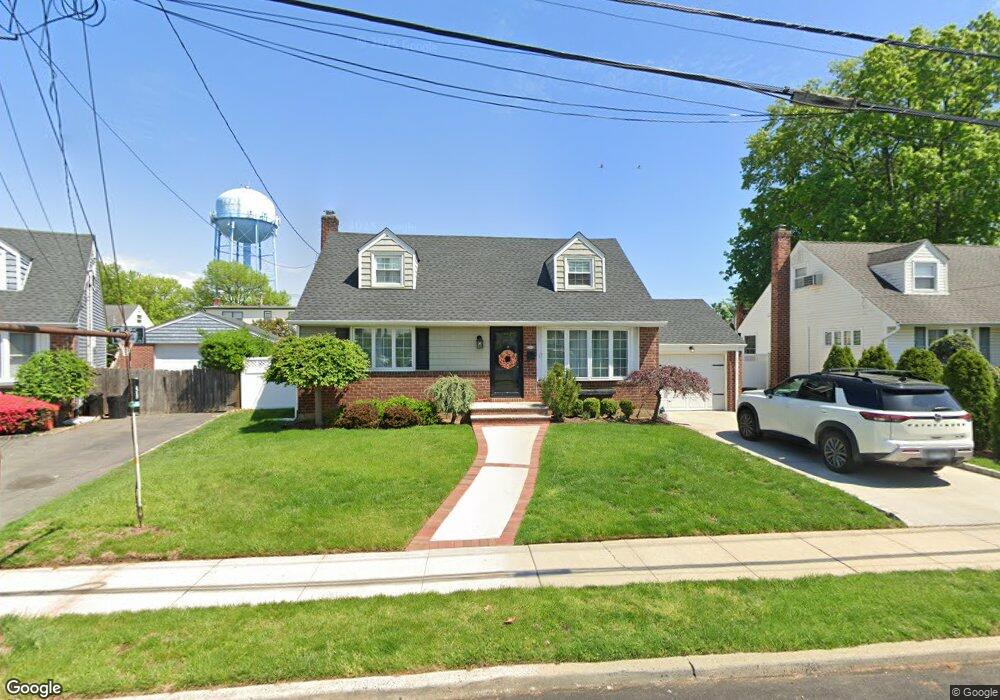
980 Maple Dr Franklin Square, NY 11010
Estimated Value: $774,000 - $807,006
Studio
2
Baths
1,955
Sq Ft
$404/Sq Ft
Est. Value
About This Home
This home is located at 980 Maple Dr, Franklin Square, NY 11010 and is currently estimated at $790,503, approximately $404 per square foot. 980 Maple Dr is a home located in Nassau County with nearby schools including St Anne's School.
Ownership History
Date
Name
Owned For
Owner Type
Purchase Details
Closed on
Apr 9, 2016
Sold by
Romano Matthew A
Bought by
Romano Matthew A and Romano Jennifer J
Current Estimated Value
Purchase Details
Closed on
Apr 9, 2015
Sold by
Romano Janet L and Romano Matthew A
Bought by
Romano Matthew A
Home Financials for this Owner
Home Financials are based on the most recent Mortgage that was taken out on this home.
Original Mortgage
$155,534
Outstanding Balance
$120,253
Interest Rate
3.86%
Mortgage Type
New Conventional
Estimated Equity
$670,250
Purchase Details
Closed on
Dec 12, 2011
Sold by
Romano Anthony M and Romano Janet
Bought by
Romano Janet L and Romano Matthew A
Home Financials for this Owner
Home Financials are based on the most recent Mortgage that was taken out on this home.
Original Mortgage
$200,000
Interest Rate
3.99%
Mortgage Type
Purchase Money Mortgage
Purchase Details
Closed on
May 24, 1997
Create a Home Valuation Report for This Property
The Home Valuation Report is an in-depth analysis detailing your home's value as well as a comparison with similar homes in the area
Home Values in the Area
Average Home Value in this Area
Purchase History
| Date | Buyer | Sale Price | Title Company |
|---|---|---|---|
| Romano Matthew A | -- | First American Title Insuran | |
| Romano Matthew A | $144,000 | First American Title | |
| Romano Janet L | $150,000 | -- | |
| -- | -- | -- |
Source: Public Records
Mortgage History
| Date | Status | Borrower | Loan Amount |
|---|---|---|---|
| Open | Romano Matthew A | $155,534 | |
| Previous Owner | Romano Janet L | $200,000 |
Source: Public Records
Tax History
| Year | Tax Paid | Tax Assessment Tax Assessment Total Assessment is a certain percentage of the fair market value that is determined by local assessors to be the total taxable value of land and additions on the property. | Land | Improvement |
|---|---|---|---|---|
| 2025 | $12,738 | $613 | $308 | $305 |
| 2024 | $5,109 | $579 | $287 | $292 |
Source: Public Records
Map
Nearby Homes
- 215 Monroe St
- 888 Court Rd
- 182 Lexington Ave
- 114 Lexington Ave
- 40 Vassar St
- 55 Vassar St
- 51 Pacific St
- 32 Madison Ave
- 92 Amherst St
- 90 Amherst St
- 348 Fairway Dr
- 272 Jefferson Ave
- 62 Poppy Ave
- 120 Barrymore Blvd
- 109 Caroline Ave
- 41 Goldenrod Ave
- 121 Farnum Blvd
- 715 Iris St
- 172 Fernwood Terrace
- 1065 Russell St
- 974 Maple Dr
- 984 Maple Dr
- 245 Courthouse Rd
- 251 Courthouse Rd
- 239 Courthouse Rd
- 968 Maple Dr
- 988 Maple Dr
- 993 Maple Dr
- 257 Courthouse Rd
- 233 Courthouse Rd
- 969 Cherry Ln
- 973 Maple Dr
- 962 Maple Dr
- 963 Maple Dr
- 263 Courthouse Rd
- 227 Courthouse Rd
- 959 Cherry Ln
- 925 Cherry Ln
- 931 Cherry Ln
- 236 Courthouse Rd
Your Personal Tour Guide
Ask me questions while you tour the home.