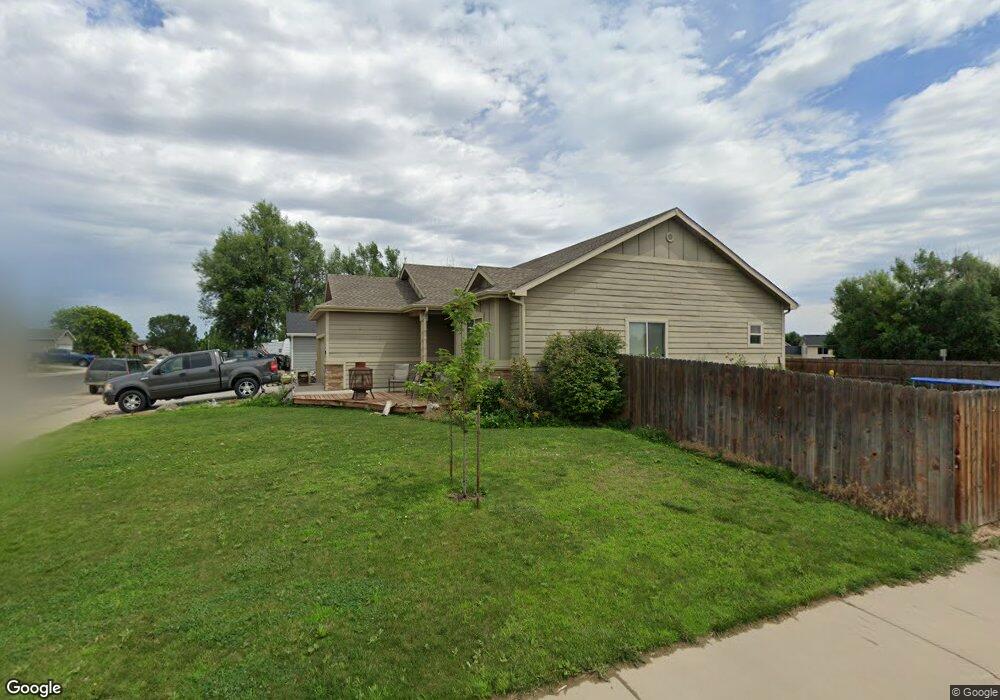
980 S Rachel Ave Milliken, CO 80543
Estimated Value: $426,000 - $508,000
3
Beds
2
Baths
1,475
Sq Ft
$315/Sq Ft
Est. Value
About This Home
This home is located at 980 S Rachel Ave, Milliken, CO 80543 and is currently estimated at $464,676, approximately $315 per square foot. 980 S Rachel Ave is a home located in Weld County with nearby schools including Milliken Elementary School, Milliken Middle School, and Roosevelt High School.
Ownership History
Date
Name
Owned For
Owner Type
Purchase Details
Closed on
Feb 15, 2012
Sold by
Windmills Llc
Bought by
Vining Robert A
Current Estimated Value
Home Financials for this Owner
Home Financials are based on the most recent Mortgage that was taken out on this home.
Original Mortgage
$165,535
Outstanding Balance
$113,734
Interest Rate
3.95%
Mortgage Type
New Conventional
Estimated Equity
$350,942
Purchase Details
Closed on
Sep 29, 2011
Sold by
Rfj Llc
Bought by
Windmills Llc
Purchase Details
Closed on
Sep 2, 2009
Sold by
Unisyn Capital Corporation
Bought by
R F J Llc
Home Financials for this Owner
Home Financials are based on the most recent Mortgage that was taken out on this home.
Original Mortgage
$525,500
Interest Rate
5.26%
Mortgage Type
Unknown
Purchase Details
Closed on
Jan 13, 2009
Sold by
Mountain Vista Builders Inc
Bought by
Unisyn Capital Corporation
Purchase Details
Closed on
Feb 8, 2001
Sold by
Milliken Vista Development Llc
Bought by
Mountain Vista Builders Inc
Create a Home Valuation Report for This Property
The Home Valuation Report is an in-depth analysis detailing your home's value as well as a comparison with similar homes in the area
Home Values in the Area
Average Home Value in this Area
Purchase History
| Date | Buyer | Sale Price | Title Company |
|---|---|---|---|
| Vining Robert A | $162,299 | Heritage Title | |
| Windmills Llc | $14,995 | Heritage Title | |
| R F J Llc | -- | None Available | |
| Unisyn Capital Corporation | -- | None Available | |
| Mountain Vista Builders Inc | $2,853,440 | Land Title Guarantee Company |
Source: Public Records
Mortgage History
| Date | Status | Borrower | Loan Amount |
|---|---|---|---|
| Open | Vining Robert A | $165,535 | |
| Previous Owner | R F J Llc | $525,500 |
Source: Public Records
Tax History Compared to Growth
Tax History
| Year | Tax Paid | Tax Assessment Tax Assessment Total Assessment is a certain percentage of the fair market value that is determined by local assessors to be the total taxable value of land and additions on the property. | Land | Improvement |
|---|---|---|---|---|
| 2025 | $2,586 | $28,270 | $5,880 | $22,390 |
| 2024 | $2,586 | $28,270 | $5,880 | $22,390 |
| 2023 | $2,641 | $30,020 | $5,410 | $24,610 |
| 2022 | $2,756 | $23,510 | $4,380 | $19,130 |
| 2021 | $2,976 | $24,180 | $4,500 | $19,680 |
| 2020 | $2,662 | $22,090 | $3,580 | $18,510 |
| 2019 | $2,092 | $22,090 | $3,580 | $18,510 |
| 2018 | $1,848 | $19,070 | $3,020 | $16,050 |
| 2017 | $1,850 | $19,070 | $3,020 | $16,050 |
| 2016 | $1,540 | $15,730 | $2,270 | $13,460 |
| 2015 | $1,565 | $15,730 | $2,270 | $13,460 |
| 2014 | $1,225 | $12,450 | $1,190 | $11,260 |
Source: Public Records
Map
Nearby Homes
- 140 E Lilac St
- 280 E Katsura St
- 381 E Mountain Ash St
- 1130 S Marjorie Ave
- 576 S Honeylocust Ct
- 226 W Forest St
- 105 S Laura Ave
- 209 S Josephine Ave
- 218 S Josephine Ave
- 1530 S Haymaker Dr
- 103 N Josephine Ave Unit LOT 36
- 0 Broad St Unit RECIR992751
- 0 Broad St Unit RECIR992750
- 208 S Frances Ave
- 1576 S Frances Ave
- 113 S Frances Ave
- 381 Bobcat Dr
- 0 S Cora Ave
- 1305 S Cattleman Dr
- 622 Traildust Dr
- 960 S Rachel Ave
- 990 S Rachel Ct
- 97 W Lilac St
- 940 S Rachel Ave
- 61 E Lilac St
- 961 S Rachel Ave
- 992 S Rachel Ct
- 107 W Lilac St
- 991 S Rachel Ct
- 920 S Rachel Ave
- 941 S Rachel Ave
- 60 E Lilac St
- 110 Katsura Cir
- 81 E Lilac St
- 1001 S Rachel Ct
- 100 Katsura Cir
- 127 W Lilac St
- 921 S Rachel Ave
- 80 E Lilac St
- 890 S Rachel Ave