980 Schenectady Ave Brooklyn, NY 11203
East Flatbush NeighborhoodEstimated Value: $721,000 - $794,661
4
Beds
2
Baths
1,536
Sq Ft
$492/Sq Ft
Est. Value
About This Home
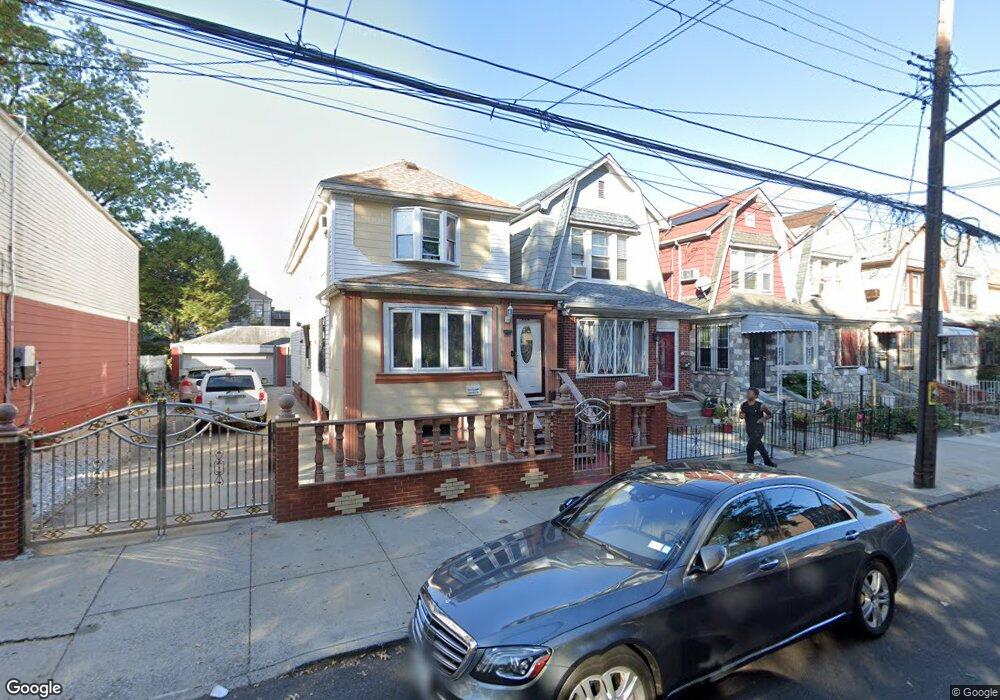
This home is located at 980 Schenectady Ave, Brooklyn, NY 11203 and is currently estimated at $756,415, approximately $492 per square foot. 980 Schenectady Ave is a home located in Kings County with nearby schools including Ps 135 Sheldon A Brookner, East Flatbush Community Research School, and East Flatbush Ascend Charter School.
Ownership History
Date
Name
Owned For
Owner Type
Purchase Details
Closed on
Mar 2, 2016
Sold by
Kendall Renee
Bought by
Phillips Lynette
Current Estimated Value
Purchase Details
Closed on
Nov 23, 2015
Sold by
Goldman Joseph
Bought by
Kendall Renee
Home Financials for this Owner
Home Financials are based on the most recent Mortgage that was taken out on this home.
Original Mortgage
$482,295
Interest Rate
3.77%
Mortgage Type
New Conventional
Purchase Details
Closed on
Jul 24, 2014
Sold by
Abou-Diop Mamadou
Bought by
Goldman Joseph
Purchase Details
Closed on
Dec 11, 2007
Sold by
Mcclean Delores
Bought by
Diop Mamadou
Home Financials for this Owner
Home Financials are based on the most recent Mortgage that was taken out on this home.
Original Mortgage
$417,000
Interest Rate
6.27%
Mortgage Type
Purchase Money Mortgage
Purchase Details
Closed on
Mar 20, 2007
Sold by
James Gabriel
Bought by
Mcclean Dolores
Create a Home Valuation Report for This Property
The Home Valuation Report is an in-depth analysis detailing your home's value as well as a comparison with similar homes in the area
Home Values in the Area
Average Home Value in this Area
Purchase History
| Date | Buyer | Sale Price | Title Company |
|---|---|---|---|
| Phillips Lynette | -- | -- | |
| Kendall Renee | $499,500 | -- | |
| Goldman Joseph | $200,000 | -- | |
| Goldman Joseph | $200,000 | -- | |
| Diop Mamadou | $480,000 | -- | |
| Diop Mamadou | $480,000 | -- | |
| Mcclean Dolores | -- | -- | |
| Mcclean Dolores | -- | -- |
Source: Public Records
Mortgage History
| Date | Status | Borrower | Loan Amount |
|---|---|---|---|
| Previous Owner | Kendall Renee | $482,295 | |
| Previous Owner | Diop Mamadou | $417,000 |
Source: Public Records
Tax History Compared to Growth
Tax History
| Year | Tax Paid | Tax Assessment Tax Assessment Total Assessment is a certain percentage of the fair market value that is determined by local assessors to be the total taxable value of land and additions on the property. | Land | Improvement |
|---|---|---|---|---|
| 2025 | $5,856 | $47,040 | $15,120 | $31,920 |
| 2024 | $5,856 | $44,040 | $15,120 | $28,920 |
| 2023 | $5,586 | $53,640 | $15,120 | $38,520 |
| 2022 | $5,181 | $45,540 | $15,120 | $30,420 |
| 2021 | $5,152 | $49,320 | $15,120 | $34,200 |
| 2020 | $2,561 | $40,380 | $15,120 | $25,260 |
| 2019 | $5,083 | $40,380 | $15,120 | $25,260 |
| 2018 | $4,673 | $22,922 | $10,757 | $12,165 |
| 2017 | $4,408 | $21,626 | $12,853 | $8,773 |
| 2016 | $4,079 | $20,402 | $12,983 | $7,419 |
| 2015 | $2,461 | $20,402 | $14,070 | $6,332 |
| 2014 | $2,461 | $20,247 | $13,562 | $6,685 |
Source: Public Records
Map
Nearby Homes
- 976 Schenectady Ave
- 517 W 46th St Unit 601
- 517 W 46th St Unit 201
- 519 E 46th St
- 542 E 48th St
- 4513 Snyder Ave
- 4814 Snyder Ave
- 4815 Tilden Ave
- 491 E 49th St
- 529 E 49th St
- 543 E 49th St
- 984 Troy Ave
- 4312 Snyder Ave
- 4721 Church Ave
- 266 E 43rd St
- 4715 Beverley Rd
- 400 E 49th St
- 4211 Snyder Ave
- 385 E 46th St
- 436 E 51st St
- 978 Schenectady Ave
- 984 Schenectady Ave
- 974 Schenectady Ave
- 972 Schenectady Ave
- 990 Schenectady Ave
- 511 E 46th St
- 511 E 46 St
- 968 Schenectady Ave
- 515 E 46th St
- 509 E 46th St Unit 2
- 509 E 46th St
- 517 W 46th St Unit PH705
- 517 W 46th St Unit PH704
- 517 W 46th St Unit PH703
- 517 W 46th St Unit PH702
- 517 W 46th St Unit PH701
- 517 W 46th St Unit 607
- 517 W 46th St Unit 606
- 517 W 46th St Unit 605
- 517 W 46th St Unit 604