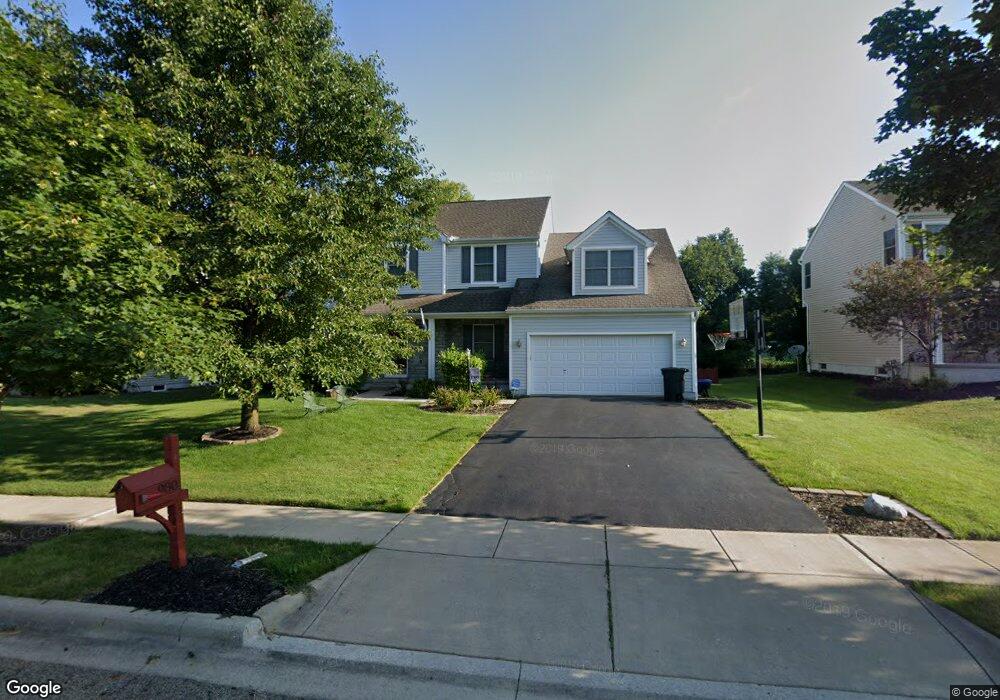
980 Washington St Unit 187 Pickerington, OH 43147
Estimated Value: $462,000 - $489,000
3
Beds
3
Baths
2,521
Sq Ft
$188/Sq Ft
Est. Value
About This Home
This home is located at 980 Washington St Unit 187, Pickerington, OH 43147 and is currently estimated at $473,714, approximately $187 per square foot. 980 Washington St Unit 187 is a home located in Fairfield County with nearby schools including Pickerington Elementary School, Diley Middle School, and Pickerington Ridgeview Junior High School.
Ownership History
Date
Name
Owned For
Owner Type
Purchase Details
Closed on
Jan 23, 2021
Sold by
Conley Stacy M and Conley Zachary D
Bought by
Conley Stacy M
Current Estimated Value
Purchase Details
Closed on
Sep 28, 2018
Sold by
Bauer Peter K and Bauer Keira T
Bought by
Conley Stacy M and Conley Zachary D
Home Financials for this Owner
Home Financials are based on the most recent Mortgage that was taken out on this home.
Original Mortgage
$282,783
Outstanding Balance
$247,233
Interest Rate
4.62%
Mortgage Type
FHA
Estimated Equity
$226,481
Purchase Details
Closed on
Apr 28, 2005
Sold by
Dominion Homes Inc
Bought by
Bauer Peter K and Bauer Keira T
Home Financials for this Owner
Home Financials are based on the most recent Mortgage that was taken out on this home.
Original Mortgage
$211,240
Interest Rate
6.75%
Mortgage Type
Fannie Mae Freddie Mac
Create a Home Valuation Report for This Property
The Home Valuation Report is an in-depth analysis detailing your home's value as well as a comparison with similar homes in the area
Home Values in the Area
Average Home Value in this Area
Purchase History
| Date | Buyer | Sale Price | Title Company |
|---|---|---|---|
| Conley Stacy M | -- | Old Republic Title | |
| Conley Stacy M | $288,000 | None Available | |
| Bauer Peter K | $264,100 | Alliance Title |
Source: Public Records
Mortgage History
| Date | Status | Borrower | Loan Amount |
|---|---|---|---|
| Open | Conley Stacy M | $282,783 | |
| Previous Owner | Bauer Peter K | $211,240 | |
| Closed | Bauer Peter K | $26,405 |
Source: Public Records
Tax History Compared to Growth
Tax History
| Year | Tax Paid | Tax Assessment Tax Assessment Total Assessment is a certain percentage of the fair market value that is determined by local assessors to be the total taxable value of land and additions on the property. | Land | Improvement |
|---|---|---|---|---|
| 2024 | $15,245 | $123,840 | $16,490 | $107,350 |
| 2023 | $5,838 | $123,840 | $16,490 | $107,350 |
| 2022 | $5,857 | $123,840 | $16,490 | $107,350 |
| 2021 | $5,459 | $98,290 | $15,710 | $82,580 |
| 2020 | $5,519 | $98,290 | $15,710 | $82,580 |
| 2019 | $5,553 | $98,290 | $15,710 | $82,580 |
| 2018 | $5,067 | $78,120 | $15,710 | $62,410 |
| 2017 | $5,074 | $78,170 | $15,760 | $62,410 |
| 2016 | $5,049 | $78,170 | $15,760 | $62,410 |
| 2015 | $4,843 | $70,910 | $13,710 | $57,200 |
| 2014 | $4,785 | $70,910 | $13,710 | $57,200 |
| 2013 | $4,785 | $70,910 | $13,710 | $57,200 |
Source: Public Records
Map
Nearby Homes
- 908 Washington St
- 165 Norland Dr
- 165 Lorrimore Dr
- 192 Kidbrooke Dr
- 183 Kidbrooke Dr
- 161 Lorrimore Dr
- 184 Kidbrooke Dr
- 157 Lorrimore Dr
- 155 Lorrimore Dr
- 106 Portrait Cir
- 153 Lorrimore Dr
- 145 Lorrimore Dr
- 149 Lorrimore Dr
- 147 Lorrimore Dr
- 540 Fullers Cir Unit 103
- 0 Windmiller Dr
- 165 Balderson Dr
- 123 Rolling Meadow Ct
- Newcastle Plan at Longview Highlands
- Henley Plan at Longview Highlands
- 980 Washington St
- 980 Washington St Unit 184
- 984 Washington St
- 976 Washington St
- 976 Washington St Unit 188
- 972 Washington St Unit WNP189
- 972 Washington St
- 951 Washington St
- 988 Washington St
- 955 Washington St
- 955 Washington St Unit 171
- 947 Washington St
- 968 Washington St
- 959 Washington St
- 992 Washington St
- 992 Washington St Unit 184
- 901 Boggs Ct
- 901 Boggs Ct Unit 168
- 963 Washington St
- 964 Washington St