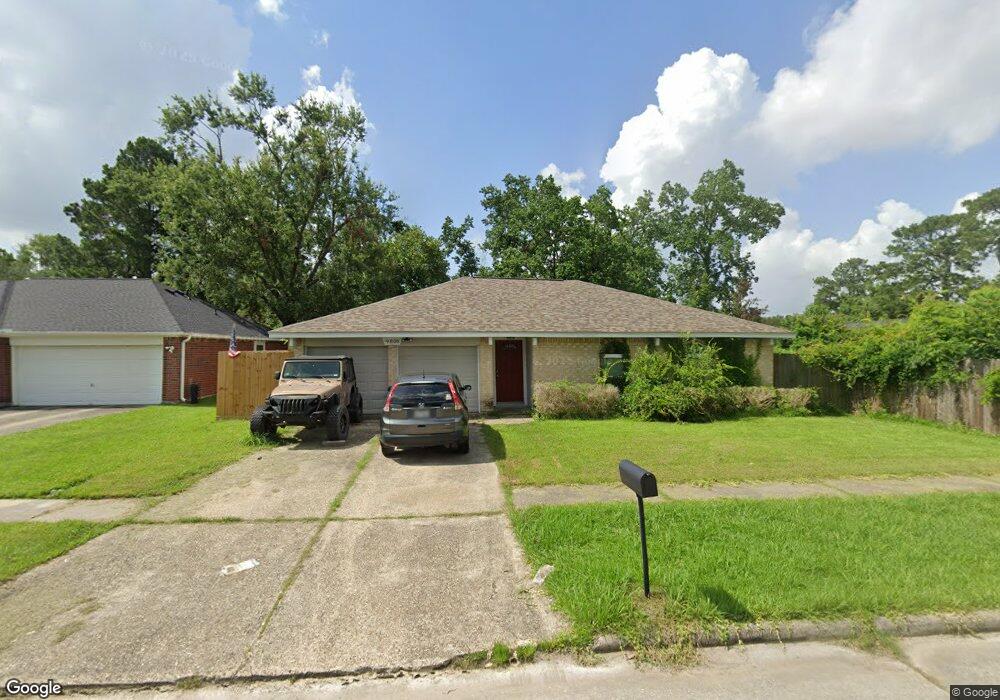
9806 Bobolink Dr Conroe, TX 77385
Estimated Value: $211,710 - $233,000
--
Bed
2
Baths
1,284
Sq Ft
$173/Sq Ft
Est. Value
About This Home
This home is located at 9806 Bobolink Dr, Conroe, TX 77385 and is currently estimated at $221,928, approximately $172 per square foot. 9806 Bobolink Dr is a home located in Montgomery County with nearby schools including Oak Ridge Elementary School, Irons J High School, and Vogel Intermediate School.
Ownership History
Date
Name
Owned For
Owner Type
Purchase Details
Closed on
Aug 1, 2024
Sold by
Ann Harris Chaffin Trust and Harris June Brickson
Bought by
Ej Harris Family Properties Llc-Series C
Current Estimated Value
Purchase Details
Closed on
Jun 27, 2017
Sold by
Harris June Brickson - Estate Of
Bought by
Chaffin Ann Harris
Purchase Details
Closed on
Dec 19, 2002
Sold by
Hudspeth Joseph D and Hudspeth Elvira P
Bought by
Harris June Brickson
Home Financials for this Owner
Home Financials are based on the most recent Mortgage that was taken out on this home.
Original Mortgage
$57,400
Interest Rate
6.05%
Mortgage Type
Balloon
Purchase Details
Closed on
Jun 1, 1995
Sold by
Gleason Steven L and Gleason Constance F
Bought by
Hudspeth Joseph D and Hudspeth Elvira P
Home Financials for this Owner
Home Financials are based on the most recent Mortgage that was taken out on this home.
Original Mortgage
$46,350
Interest Rate
8.2%
Create a Home Valuation Report for This Property
The Home Valuation Report is an in-depth analysis detailing your home's value as well as a comparison with similar homes in the area
Home Values in the Area
Average Home Value in this Area
Purchase History
| Date | Buyer | Sale Price | Title Company |
|---|---|---|---|
| Ej Harris Family Properties Llc-Series C | -- | None Listed On Document | |
| Chaffin Ann Harris | -- | -- | |
| Harris June Brickson | -- | American Title Co | |
| Hudspeth Joseph D | -- | -- |
Source: Public Records
Mortgage History
| Date | Status | Borrower | Loan Amount |
|---|---|---|---|
| Previous Owner | Harris June Brickson | $57,400 | |
| Previous Owner | Hudspeth Joseph D | $46,350 |
Source: Public Records
Tax History Compared to Growth
Tax History
| Year | Tax Paid | Tax Assessment Tax Assessment Total Assessment is a certain percentage of the fair market value that is determined by local assessors to be the total taxable value of land and additions on the property. | Land | Improvement |
|---|---|---|---|---|
| 2025 | $3,244 | $109,000 | $29,568 | $79,432 |
| 2024 | $3,244 | $146,061 | $29,568 | $116,493 |
| 2023 | $3,555 | $160,000 | $29,570 | $130,430 |
| 2022 | $3,172 | $154,620 | $29,570 | $125,050 |
| 2021 | $3,134 | $120,120 | $29,570 | $90,550 |
| 2020 | $3,313 | $120,120 | $29,570 | $90,550 |
| 2019 | $3,078 | $106,700 | $16,900 | $89,800 |
| 2018 | $2,844 | $98,600 | $16,900 | $81,700 |
| 2017 | $2,898 | $98,600 | $16,900 | $81,700 |
| 2016 | $2,620 | $89,140 | $16,900 | $72,240 |
| 2015 | $2,520 | $89,900 | $16,900 | $73,000 |
| 2014 | $2,520 | $78,100 | $16,900 | $61,200 |
Source: Public Records
Map
Nearby Homes
- 9838 Bobolink Dr
- 11 Snow Woods Ct
- 16731 Foursquare Dr
- 74 Wimberly Way
- 22 Nila Grove Ct
- 16754 N Blue Jay Dr
- 9921 Kingfisher Dr
- 9807 Toucan Ln
- 16771 N Rail Dr
- 16778 N Gull Dr
- 16751 N Rail Dr
- 123 Genesee Ridge Dr
- 16802 Accolade Way
- 16774 Fallen Timbers Dr
- 9907 Western Ridge Way
- 38 Florian Ct
- 16743 Fallen Timbers Dr
- 16937 Larkspur
- 99 N Delta Mill Cir
- 16916 Tableland Trail
- 9810 Bobolink Dr
- 16805 Gleneagle Dr N
- 16801 Gleneagle Dr N
- 9814 Bobolink Dr
- 9805 Heron Ln
- 16809 Gleneagle Dr N
- 9809 Heron Ln
- 9813 Heron Ln
- 9818 Bobolink Dr
- 16813 Gleneagle Dr N
- 9803 Bobolink Dr
- 9807 Bobolink Dr
- 9817 Heron Ln
- 16787 Warbler Dr
- 9822 Bobolink Dr
- 16787 Gleneagle Dr N
- 16778 Warbler Dr
- 16783 Warbler Dr
- 16802 Gleneagle Dr N
- 16817 Gleneagle Dr N