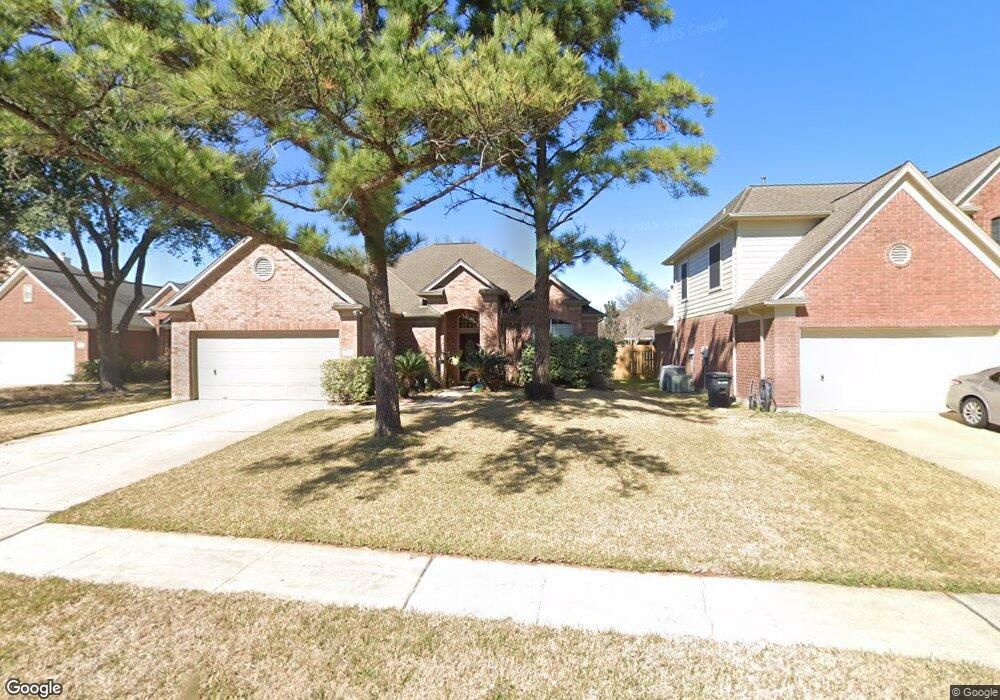
9806 Sandtown Cir Houston, TX 77064
Estimated Value: $309,341 - $350,000
3
Beds
2
Baths
2,144
Sq Ft
$155/Sq Ft
Est. Value
About This Home
This home is located at 9806 Sandtown Cir, Houston, TX 77064 and is currently estimated at $332,085, approximately $154 per square foot. 9806 Sandtown Cir is a home located in Harris County with nearby schools including Gleason Elementary School, Cook Middle School, and Jersey Village High School.
Ownership History
Date
Name
Owned For
Owner Type
Purchase Details
Closed on
Jun 15, 2007
Sold by
Hicks Randall W
Bought by
Delgado Alfredo C and Flores Margarita M
Current Estimated Value
Home Financials for this Owner
Home Financials are based on the most recent Mortgage that was taken out on this home.
Original Mortgage
$162,750
Outstanding Balance
$99,424
Interest Rate
6.16%
Mortgage Type
Purchase Money Mortgage
Estimated Equity
$232,661
Purchase Details
Closed on
Oct 23, 1998
Sold by
Mayo Tracy D and Mayo Marla
Bought by
Hicks Randall W
Home Financials for this Owner
Home Financials are based on the most recent Mortgage that was taken out on this home.
Original Mortgage
$91,600
Interest Rate
6.46%
Purchase Details
Closed on
Nov 20, 1995
Sold by
Pulte Home Corp Of Texas
Bought by
Mayo Tracy D
Home Financials for this Owner
Home Financials are based on the most recent Mortgage that was taken out on this home.
Original Mortgage
$103,050
Interest Rate
7.53%
Create a Home Valuation Report for This Property
The Home Valuation Report is an in-depth analysis detailing your home's value as well as a comparison with similar homes in the area
Home Values in the Area
Average Home Value in this Area
Purchase History
| Date | Buyer | Sale Price | Title Company |
|---|---|---|---|
| Delgado Alfredo C | -- | Chicago Title Insurance Co | |
| Hicks Randall W | -- | American Title Company | |
| Mayo Tracy D | -- | American Title Company |
Source: Public Records
Mortgage History
| Date | Status | Borrower | Loan Amount |
|---|---|---|---|
| Open | Delgado Alfredo C | $162,750 | |
| Previous Owner | Hicks Randall W | $91,600 | |
| Previous Owner | Mayo Tracy D | $103,050 |
Source: Public Records
Tax History Compared to Growth
Tax History
| Year | Tax Paid | Tax Assessment Tax Assessment Total Assessment is a certain percentage of the fair market value that is determined by local assessors to be the total taxable value of land and additions on the property. | Land | Improvement |
|---|---|---|---|---|
| 2025 | $4,247 | $333,028 | $82,265 | $250,763 |
| 2024 | $4,247 | $277,583 | $74,927 | $202,656 |
| 2023 | $4,247 | $361,431 | $74,927 | $286,504 |
| 2022 | $6,790 | $316,652 | $62,568 | $254,084 |
| 2021 | $6,552 | $262,681 | $62,568 | $200,113 |
| 2020 | $6,212 | $225,527 | $37,335 | $188,192 |
| 2019 | $6,034 | $211,313 | $28,323 | $182,990 |
| 2018 | $1,964 | $201,752 | $28,323 | $173,429 |
| 2017 | $5,924 | $201,752 | $28,323 | $173,429 |
| 2016 | $5,661 | $192,787 | $28,323 | $164,464 |
| 2015 | $3,972 | $179,486 | $28,323 | $151,163 |
| 2014 | $3,972 | $165,364 | $28,323 | $137,041 |
Source: Public Records
Map
Nearby Homes
- 9203 Cabin Creek Dr
- 9302 Stone Porch Ln
- 9219 Chester Park Dr
- 9210 Skipping Stone Ln
- 9715 Therrell Dr
- 8918 Burleson Ct
- 9619 Therrell Dr
- 8822 Ballinger Dr
- 9710 Arrowgrass Dr
- 9714 Arrowgrass Dr
- 9203 S Pass Ln
- 9607 Trailing Moss Dr
- 10223 Dude Rd
- 10119 Autumn Way Ct
- 9314 Tascosa Ln
- 9530 Tarrant Ct
- 10219 Trading Post Dr
- 10402 Hondo Hill Rd
- 9135 Eaglecove Dr
- 8511 Parmer Ct
- 9810 Sandtown Cir
- 9802 Sandtown Cir
- 9807 Corral Path Ct
- 9803 Corral Path Ct
- 9814 Sandtown Cir
- 9123 Sandtown Ln
- 9811 Corral Path Ct
- 9811 Sandtown Cir
- 9818 Sandtown Cir
- 9134 Sandtown Ln
- 9130 Sandtown Ln
- 9119 Sandtown Ln
- 9815 Sandtown Cir
- 9202 Sandtown Ln
- 9126 Sandtown Ln
- 9823 Sandtown Cir
- 9815 Corral Path Ct
- 9206 Sandtown Ln
- 18938 Corral Path Ct
- 18942 Corral Path Ct