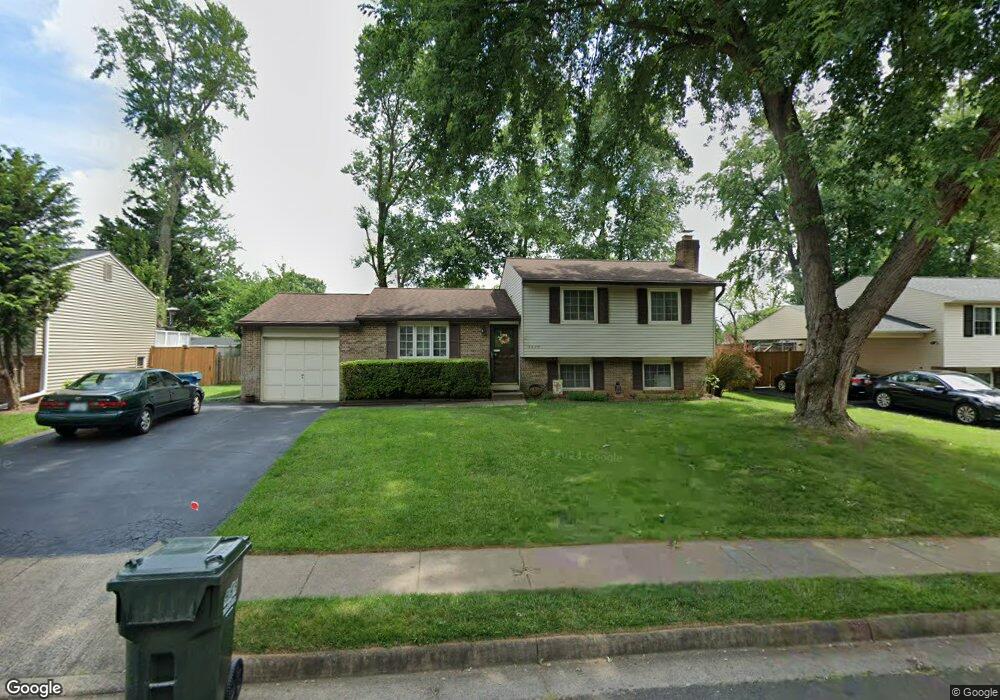
9807 Oleander Ave Vienna, VA 22181
Estimated Value: $799,000 - $865,000
3
Beds
3
Baths
1,040
Sq Ft
$796/Sq Ft
Est. Value
About This Home
This home is located at 9807 Oleander Ave, Vienna, VA 22181 and is currently estimated at $828,322, approximately $796 per square foot. 9807 Oleander Ave is a home located in Fairfax County with nearby schools including Mosby Woods Elementary School, Thoreau Middle School, and Oakton High.
Ownership History
Date
Name
Owned For
Owner Type
Purchase Details
Closed on
Dec 15, 2025
Sold by
Saah Mazen I
Bought by
Mazen I Saah Trust and Saah
Current Estimated Value
Purchase Details
Closed on
Aug 6, 2007
Sold by
Ngo Kien Seng
Bought by
Saah Mazen I
Home Financials for this Owner
Home Financials are based on the most recent Mortgage that was taken out on this home.
Original Mortgage
$370,000
Interest Rate
6.73%
Mortgage Type
New Conventional
Purchase Details
Closed on
Aug 17, 2005
Sold by
Steen Peter M
Bought by
Ngo Kien Seng and Yuan,Gui Zhi
Home Financials for this Owner
Home Financials are based on the most recent Mortgage that was taken out on this home.
Original Mortgage
$359,650
Interest Rate
5.68%
Mortgage Type
New Conventional
Purchase Details
Closed on
Oct 6, 1999
Sold by
Sharpe Larry R
Bought by
Steen Peter M
Home Financials for this Owner
Home Financials are based on the most recent Mortgage that was taken out on this home.
Original Mortgage
$159,200
Interest Rate
7.83%
Create a Home Valuation Report for This Property
The Home Valuation Report is an in-depth analysis detailing your home's value as well as a comparison with similar homes in the area
Home Values in the Area
Average Home Value in this Area
Purchase History
| Date | Buyer | Sale Price | Title Company |
|---|---|---|---|
| Mazen I Saah Trust | -- | None Listed On Document | |
| Saah Mazen I | $520,000 | -- | |
| Ngo Kien Seng | $542,500 | -- | |
| Steen Peter M | $199,000 | -- |
Source: Public Records
Mortgage History
| Date | Status | Borrower | Loan Amount |
|---|---|---|---|
| Previous Owner | Saah Mazen I | $370,000 | |
| Previous Owner | Ngo Kien Seng | $359,650 | |
| Previous Owner | Steen Peter M | $159,200 |
Source: Public Records
Tax History
| Year | Tax Paid | Tax Assessment Tax Assessment Total Assessment is a certain percentage of the fair market value that is determined by local assessors to be the total taxable value of land and additions on the property. | Land | Improvement |
|---|---|---|---|---|
| 2025 | $8,247 | $763,250 | $399,000 | $364,250 |
| 2024 | $8,247 | $711,830 | $399,000 | $312,830 |
| 2023 | $7,802 | $691,360 | $399,000 | $292,360 |
| 2022 | $7,544 | $659,700 | $389,000 | $270,700 |
| 2021 | $7,268 | $619,380 | $364,000 | $255,380 |
| 2020 | $6,770 | $572,020 | $344,000 | $228,020 |
| 2019 | $6,770 | $572,020 | $344,000 | $228,020 |
| 2018 | $6,406 | $557,020 | $329,000 | $228,020 |
| 2017 | $6,451 | $555,630 | $329,000 | $226,630 |
| 2016 | $6,616 | $571,090 | $319,000 | $252,090 |
| 2015 | $6,016 | $539,090 | $299,000 | $240,090 |
| 2014 | $5,653 | $507,660 | $279,000 | $228,660 |
Source: Public Records
Map
Nearby Homes
- 9804 Brightlea Dr
- 2806 Logway Rd
- 9927 Miles Stone Ct
- 9874 Palace Green Way
- 2754 Chain Bridge Rd
- 2914 Oakton Crest Place
- 9908 Blake Ln
- 9648 Masterworks Dr
- 2867 Hill Rd
- 9836 Sweet Mint Dr
- 2771 Cody Rd
- 3072 Sugar Ln
- 2715 Shawn Leigh Dr
- 9611 Scotch Haven Dr
- 10114 Oakton Terrace Rd
- 2628 Five Oaks Rd
- 2627 Five Oaks Rd
- 10024 Oakton Terrace Rd
- 10106 Bushman Dr
- 9910 Rustic Rail Ln
- 9809 Oleander Ave
- 9805 Oleander Ave
- 9852 Snowbound Ct
- 9854 Snowbound Ct
- 2801 Logway Rd
- 9806 Oleander Ave
- 9808 Oleander Ave
- 2803 Logway Rd
- 9850 Snowbound Ct
- 9804 Oleander Ave
- 9801 Oleander Ave
- 2805 Logway Rd
- 9802 Oleander Ave
- 9802 Brightlea Dr
- 9812 Oleander Ave
- 9851 Snowbound Ct
- 9800 Oleander Ave
- 2800 Logway Rd
- 9853 Snowbound Ct
- 9806 Brightlea Dr
Your Personal Tour Guide
Ask me questions while you tour the home.